|

GBP/USD Price Analysis: Hits fresh multi-week low, bears await a break below 50-day SMA

  • GBP/USD dives to over a three-week low and is pressured by strong follow-through USD buying.
  • The technical setup favours bearish traders and supports prospects for a further near-term fall.
  • A move above the ascending channel support breakpoint is needed to negate the bearish bias.

The GBP/USD pair comes under intense selling pressure on Thursday and drops to over a three-week low, around the 1.2415-1.2410 region during the early North American session.

A combination of supporting factors pushes the US Dollar (USD) to a nearly two-month high, which, in turn, is seen exerting heavy downward pressure on the GBP/USD pair. Against the backdrop of expectations that the Federal Reserve (Fed) will keep interest rates higher for longer, the latest optimism over the US debt ceiling remains supportive of elevated US Treasury bond yields. This, along with a softer tone around the equity markets, lends additional support to the safe-haven Greenback.

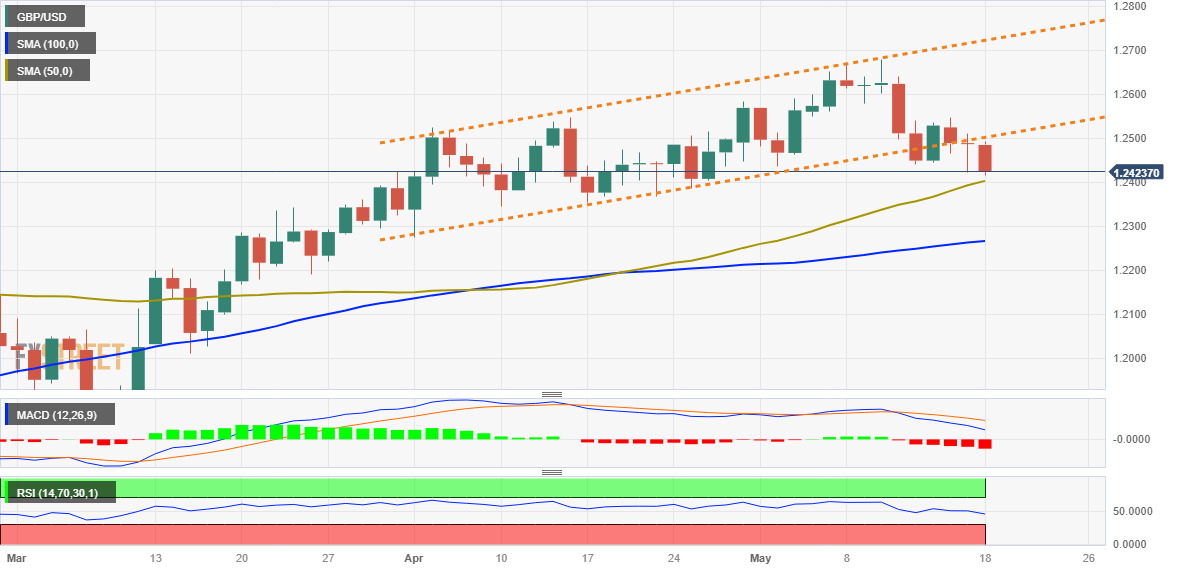
From a technical perspective, the emergence of fresh selling around the GBP/USD pair on Thursday reaffirms the recent break through the lower end of over a one-month-old ascending trend channel. Moreover, oscillators on the daily chart have started drifting in the bearish territory and add credence to the negative outlook. That said, it will be prudent to wait for some follow-through weakness below the 1.2400 mark, or the 50-day Simple Moving Average (SMA), before placing fresh bearish bets.

The GBP/USD pair might then accelerate the downfall towards the next relevant support near the 1.2375-1.2370 region before eventually dropping to the 1.2300 mark. A convincing break below the latter will set the stage for an extension of the recent sharp retracement slide from over a one-year high, around the 1.2680 region touched earlier this month.

On the flip side, any meaningful recovery attempt might now attract fresh sellers ahead of the 1.2500 psychological mark and remain capped near the 1.2530 support-turned-resistance. That said, a sustained strength beyond could trigger a fresh bout of a short-covering and allow the GBP/USD pair to reclaim the 1.2600 round figure. The momentum could get extended further towards the 1.2625-1.2630 intermediate hurdle, above which bulls might aim to retest the YTD peak, around the 1.2680 area.

GBP/USD daily chart

fxsorignal

Key levels to watch

GBP/USD

Overview
Today last price1.2434
Today Daily Change-0.0053
Today Daily Change %-0.42
Today daily open1.2487
 
Trends
Daily SMA201.2519
Daily SMA501.2393
Daily SMA1001.2263
Daily SMA2001.1966
 
Levels
Previous Daily High1.251
Previous Daily Low1.2422
Previous Weekly High1.268
Previous Weekly Low1.244
Previous Monthly High1.2584
Previous Monthly Low1.2275
Daily Fibonacci 38.2%1.2456
Daily Fibonacci 61.8%1.2476
Daily Pivot Point S11.2436
Daily Pivot Point S21.2384
Daily Pivot Point S31.2347
Daily Pivot Point R11.2524
Daily Pivot Point R21.2562
Daily Pivot Point R31.2613

Author

Haresh Menghani

Haresh Menghani is a detail-oriented professional with 10+ years of extensive experience in analysing the global financial markets.

More from Haresh Menghani
Share:

Markets move fast. We move first.

Orange Juice Newsletter brings you expert driven insights - not headlines. Every day on your inbox.

By subscribing you agree to our Terms and conditions.

Editor's Picks

EUR/USD struggles to extend advance above 1.1800

The EUR/USD pair posts a fresh weekly low near 1.1740 during the Asian trading session on Wednesday. The major currency pair is under pressure as the US Dollar edges higher despite Federal Open Market Committee minutes of the December policy meeting, released on Tuesday, showing that most policymakers stressed the need for further interest rate cuts.

GBP/USD tests 1.3450 support after moving below nine-day EMA

GBP/USD remains subdued for the second consecutive day, trading around 1.3460 during the Asian hours on Wednesday. The technical analysis of the daily chart indicates a weakening of a bullish bias as the pair is positioned slightly below the lower boundary of the ascending channel pattern.

Gold jumps on US rate cut prospects, safe-haven demand

Gold price extends the rally above $4,350 during the early European trading hours on Wednesday. Gold's price has surged about 65% this year and is set to record its biggest annual gains since 1979. The rally in the precious metal is bolstered by the prospect of further US interest rate cuts in 2026. Lower interest rates could reduce the opportunity cost of holding Gold, supporting the non-yielding precious metal.

Bitcoin, Ethereum and XRP prepare for a potential New Year rebound

Bitcoin, Ethereum, and Ripple are holding steady on Wednesday after recording minor gains on the previous day. Technically, Bitcoin could extend gains within a triangle pattern while Ethereum and Ripple face critical overhead resistance. 

Economic outlook 2026-2027 in advanced countries: Solidity test

After a year marked by global economic resilience and ending on a note of optimism, 2026 looks promising and could be a year of solid economic performance. In our baseline scenario, we expect most of the supportive factors at work in 2025 to continue to play a role in 2026.

Crypto market outlook for 2026

Year 2025 was volatile, as crypto often is.  Among positive catalysts were favourable regulatory changes in the U.S., rise of Digital Asset Treasuries (DAT), adoption of AI and tokenization of Real-World-Assets (RWA).