GBP/USD Price Analysis: Gets set to refresh 10-month high around 1.2600
- GBP/USD has shifted into an inventory adjustment phase after printing a fresh 10-month high at 1.2537.
- UK’s monthly GDP remained stagnant while the street was anticipating an expansion of 0.1%.
- US labor market conditions have loosened further as jobless claims remained higher than anticipated.

The GBP/USD pair is demonstrating a lackluster performance after printing a fresh 10-month high at 1.2537 in the early Tokyo session. The upside move in the Cable remained mostly capped in comparison with other risk-perceived currencies. The reason could be the weak United Kingdom’s monthly Gross Domestic Product (GDP) (Feb) data released on Thursday.
UK’s monthly GDP remained stagnant while the street was anticipating an expansion of 0.1%. Annual Industrial Production contracted by 3.1% against the consensus of 3.7% contraction. The Manufacturing Production data was contracted by 2.4%. The scale of contraction in Manufacturing Production was lower than the estimate of 4.7%.
The US Dollar Index (DXY) is juggling above the immediate support of 101.00. The downside bias for the USD Index looks solid as the United States Producer Price Index (PPI) softened dramatically on Thursday. Also, labor market conditions have loosened further as jobless claims remained higher than anticipated.
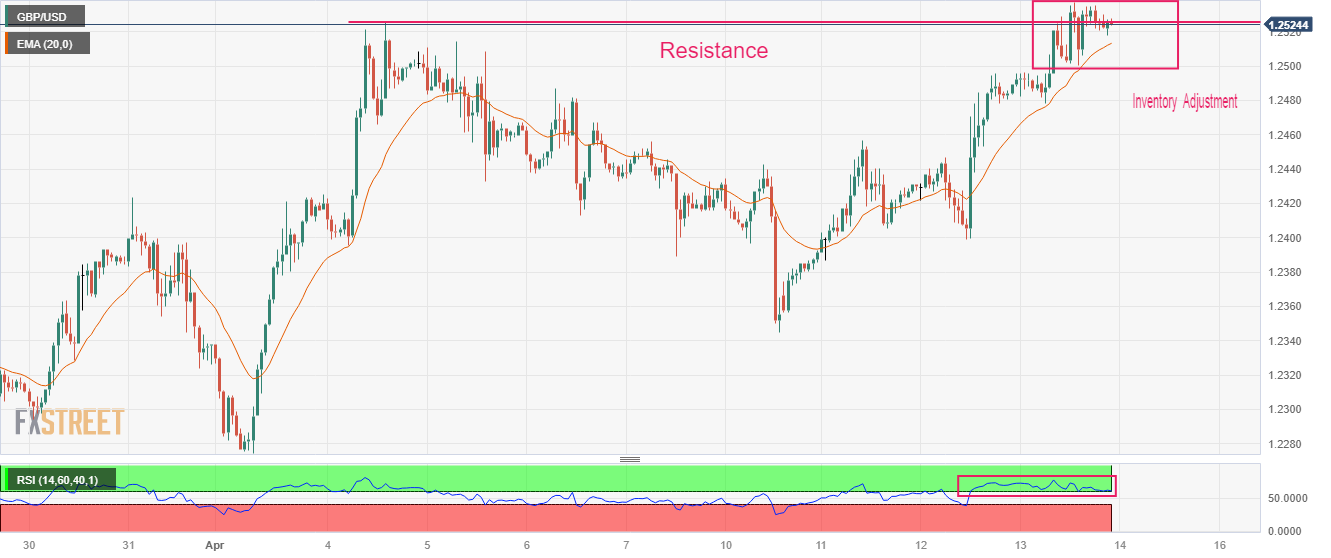
GBP/USD is showing a sheer contraction in volatility after testing the horizontal resistance plotted from April 04 high at 1.2525 on an hourly scale. The Cable is displaying an inventory adjustment move between institutional investors and retail participants. The odds are in favor of an upside break of the inventory adjustment move as the overall trend has remained bullish.
The 20-period Exponential Moving Average (EMA) at 1.2513 is providing cushion to the Pound Sterling bulls.
Meanwhile, the Relative Strength Index (RSI) (14) is oscillating in the bullish range of 60.00-80.00, indicating that the upside momentum is still active.
For further upside, the Cable needs to surpass April 13 high at 1.2537, which will drive the asset towards a fresh 10-month high at 1.2597, which is 08 June 2022 high. A breach of the latter will expose the asset to May 27 high at 1.2667.
On the flip side, a break below the round-level support of 1.2400 will expose the asset to April 10 low at 1.2344 and March 30 low at 1.2294.
GBP/USD hourly chart
Author

Sagar Dua
FXStreet
Sagar Dua is associated with the financial markets from his college days. Along with pursuing post-graduation in Commerce in 2014, he started his markets training with chart analysis.


