|

GBP/USD Price Analysis: Gains momentum, the next upside barrier is seen at 1.2640

  • GBP/USD trades in positive territory for the third consecutive day above 1.2600 on Monday.
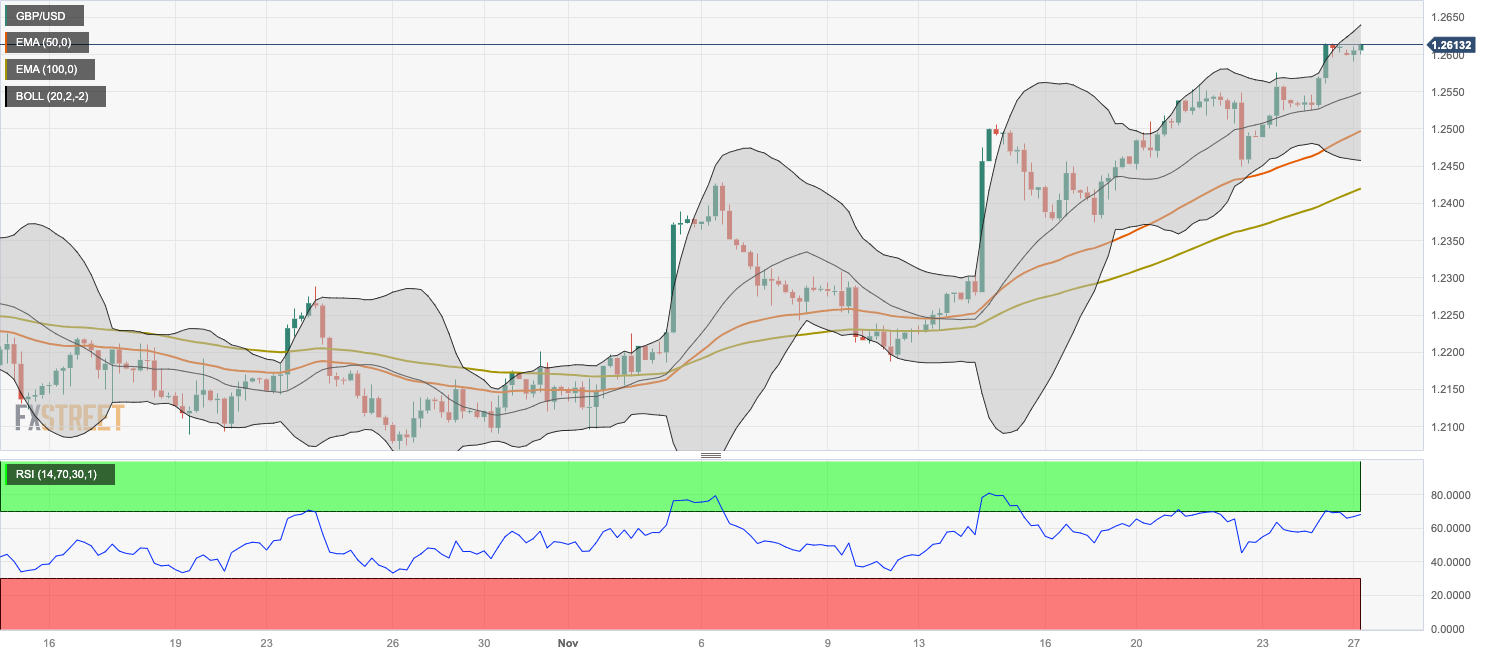
  • The pair maintains the bullish outlook above the 50- and 100-hour EMAs; the RSI indicator holds in the bullish territory above 50.
  • The first resistance level is seen at 1.2640; 1.2520 acts as an initial level for GBP/USD.

The GBP/USD pair kicks off the week in a positive mood above 1.2600, the highest level since late August during the early Europen session on Monday. The uptick of GBP/USD is bolstered by the stronger-than-expected UK S&P Global/CIPS PMI data for November and the softer US Dollar (USD). The pair currently trades near 1.2610, unchanged for the day.

Technically, GBP/USD maintains a bullish outlook as the pair holds above the 50- and 100-hour Exponential Moving Averages (EMAs) with an upward slope on the four-hour chart. The upward momentum is supported by the Relative Strength Index (RSI) that holds in the bullish territory above 50, suggesting the path of least resistance is to the upside.

That being said, the first resistance level for the pair will emerge at 1.2640. The mentioned level is the confluence of the upper boundary of the Bollinger Band and a high of September 4. A break above 1.2640 will see the next upside barrier near a high of September 1 at 1.2713, en route to 1.2800 (a high of August 22 and round figure)

On the flip side, a low of November 23 at 1.2520 acts as an initial level for GBP/USD. The additional downside filter to watch is the 50-hour EMA at 1.2497. Any follow-through selling will see a drop to the lower limit of the Bollinger Band at 1.2458. Finally, the next contention level is located near the 100-hour EMA at 1.2420.

GBP/USD four-hour chart

GBP/USD

Overview
Today last price1.2611
Today Daily Change0.0000
Today Daily Change %0.00
Today daily open1.2611
 
Trends
Daily SMA201.2358
Daily SMA501.2265
Daily SMA1001.2499
Daily SMA2001.2456
 
Levels
Previous Daily High1.2616
Previous Daily Low1.2525
Previous Weekly High1.2616
Previous Weekly Low1.2446
Previous Monthly High1.2337
Previous Monthly Low1.2037
Daily Fibonacci 38.2%1.2581
Daily Fibonacci 61.8%1.2559
Daily Pivot Point S11.2552
Daily Pivot Point S21.2493
Daily Pivot Point S31.2461
Daily Pivot Point R11.2643
Daily Pivot Point R21.2674
Daily Pivot Point R31.2733

Author

Lallalit Srijandorn

Lallalit Srijandorn is a Parisian at heart. She has lived in France since 2019 and now becomes a digital entrepreneur based in Paris and Bangkok.

More from Lallalit Srijandorn
Share:

Markets move fast. We move first.

Orange Juice Newsletter brings you expert driven insights - not headlines. Every day on your inbox.

By subscribing you agree to our Terms and conditions.

Editor's Picks

EUR/USD off three-month highs, holds near 1.1800 on softer US Dollar

EUR/USD consolidates gains below 1.1800 in the European trading hours on Wednesday. A broadly subdued US Dollar continues to underpin the pair amid quiet markets and thin liquidity conditions on Christmas Eve. 

GBP/USD keeps range around 1.3500 amid quiet markets

GBP/USD keeps its range trade intact at around 1.3500 in the European session on Wednesday. The Pound Sterling holds the upper hand over the US Dollar amid pre-Christmas light trading as traders turn to sidelines heading into the holiday season. 

Gold retreats from record highs amid profit-taking on Christmas Eve

Gold retreats following the move higher to the $4,525 area, or a fresh all-time peak, though the downside remains limited amid a bullish fundamental backdrop. The US Dollar selling bias remains unabated on the back of dovish Fed expectations, which continues to act as a tailwind for the bullion amid persistent geopolitical risks.

Shiba Inu's bears tighten grip, aiming for yearly lows

Shiba Inu price remains under pressure, trading below $0.000070 on Wednesday as bearish momentum continues to dominate the broader crypto market. On-chain and derivatives data further support the bearish sentiment, while technical analysis suggests a deeper correction targeting the yearly lows.

Economic outlook 2026-2027 in advanced countries: Solidity test

After a year marked by global economic resilience and ending on a note of optimism, 2026 looks promising and could be a year of solid economic performance. In our baseline scenario, we expect most of the supportive factors at work in 2025 to continue to play a role in 2026.

Stellar Price Forecast: XLM slips below $0.22 as bearish momentum builds

Stellar (XLM) price is trading below $0.22 at the time of writing on Wednesday after failing to close above the key resistance earlier this week. Bearish momentum continues to strengthen, with open interest falling and short bets rising.