|

GBP/USD Price Analysis: Fades bounce off 200-SMA around 1.2150

  • GBP/USD prints mild losses while keeping the pullback from support-turned-resistance.
  • 50-SMA guards immediate upside, 1.2080 appears a tough nut to crack for bears.
  • MACD signals, sustained break of three-week-old ascending trend line keep sellers hopeful.

GBP/USD licks its wounds around 1.2150 during early Friday morning in Europe. In doing so, the Cable pair retreats from the 50-SMA while fading the bounce off the 200-SMA.

The quote broke an upward sloping trend line from mid-July the previous day and stays below the same since then. The sustained trading below the previous key support joins downbeat MACD signals and a pullback from the 50-SMA to favor bears.

However, a convergence of the 200-SMA and a 50% Fibonacci retracement of the June-July downside, near 1.2080, appears strong support to crack for the bears before convincing the markets.

It’s worth noting that the early July swing high near 1.2055 can act as a validation point for the GBP/USD south-run targeting the multi-month low marked on July 14, at 1.1760.

Alternatively, recovery moves initially jostle with the 50-SMA level of 1.2150 before challenging the previous support line near 1.2170.

Even if the GBP/USD prices manage to cross the 1.2170 hurdle, a downward sloping resistance line from June 16, close to 1.2285, could challenge the bulls.

GBP/USD: Four-hour chart

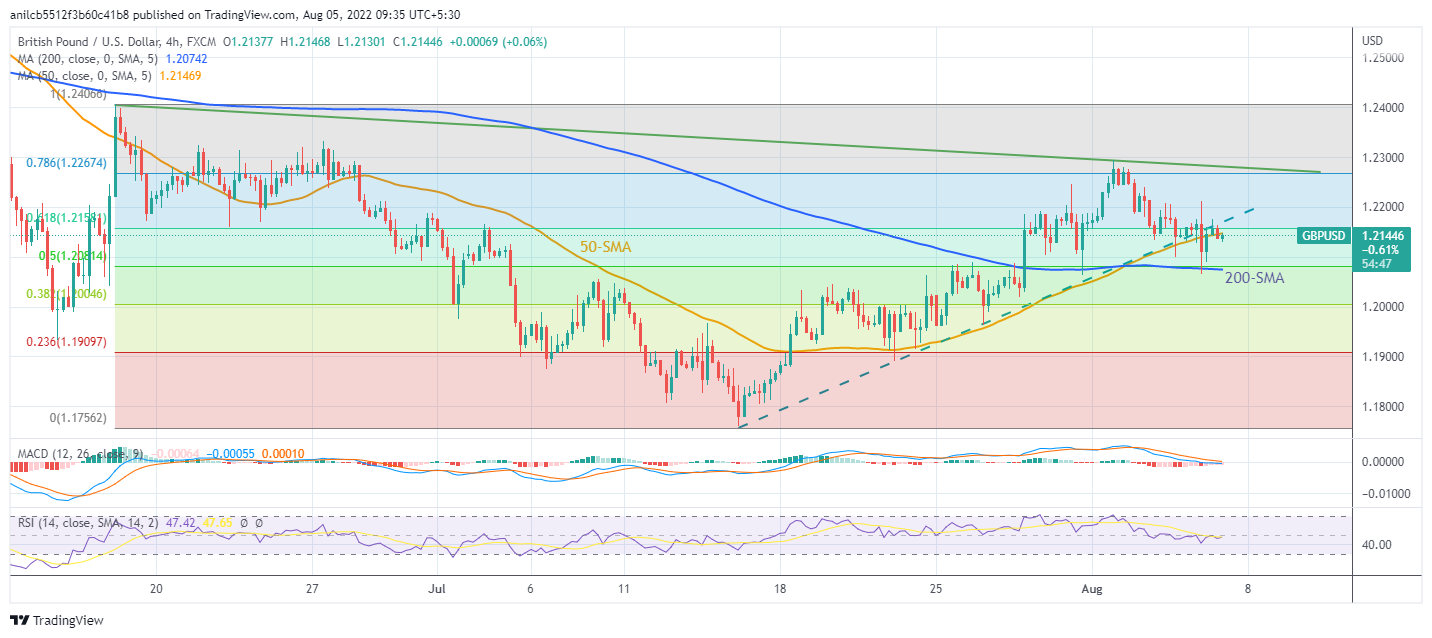
Trend: Further weakness expected

Author

Anil Panchal

Anil Panchal

FXStreet

Anil Panchal has nearly 15 years of experience in tracking financial markets. With a keen interest in macroeconomics, Anil aptly tracks global news/updates and stays well-informed about the global financial moves and their implications.

More from Anil Panchal
Share:

Editor's Picks

EUR/USD remains offered below 1.1600, seems vulnerable near multi-month low

The EUR/USD pair struggles to capitalize on the overnight bounce from the 1.1530 region, or the lowest level since November 2025, and lower for the third consecutive day on Wednesday. Spot prices slide back below the 1.1600 mark during the Asian session and seem vulnerable to slide further.

GBP/USD slips below key averages as geopolitical risks mount

GBP/USD fell about 0.35% on Tuesday, settling around 1.3350 after slipping below the 200-day Exponential Moving Average for the first time since early December. The pair has pulled back sharply from its late-January high near 1.3870, shedding over 500 pips in a series of lower highs and lower lows. 

Gold rebounds ahead of US ADP, will it last?

Gold finds renewed Asian bids and retests $5,230 early Wednesday after the heavy sell-off on Tuesday. The US Dollar stands tall amid escalating Middle East tensions and reduced dovish Fed expectations. Gold defends $5,000 or 50% Fibo level after facing rejection at the 78.6% Fibo resistance at $5,342 amid bullish RSI.  

Ethereum: Whales step up buying as short positions contract

After holding firm heading into the last weekend, Ethereum whales have returned to action, pouncing on the volatility stemming from escalating military actions between the US and Iran.

Energy shock 2.0: Why rising Gas prices could hit the Euro

Even without a confirmed, sustained disruption, the mere risk to a key global energy chokepoint is enough to inject a significant premium into European Gas markets. And for the Euro, that matters.

Ripple falters amid sell-off jitters and negative funding rates

Ripple (XRP) has come under pressure, drifting lower to $1.35 at the time of writing on Tuesday. The over 2% correction looks poised to erase the previous day’s gains, which lifted the remittance token to $1.42.