GBP/USD Price Analysis: Extends losses past 1.2700, traders eye 100-DMA
- GBP/USD edges down 0.30%, following the Bank of England's rate decision.
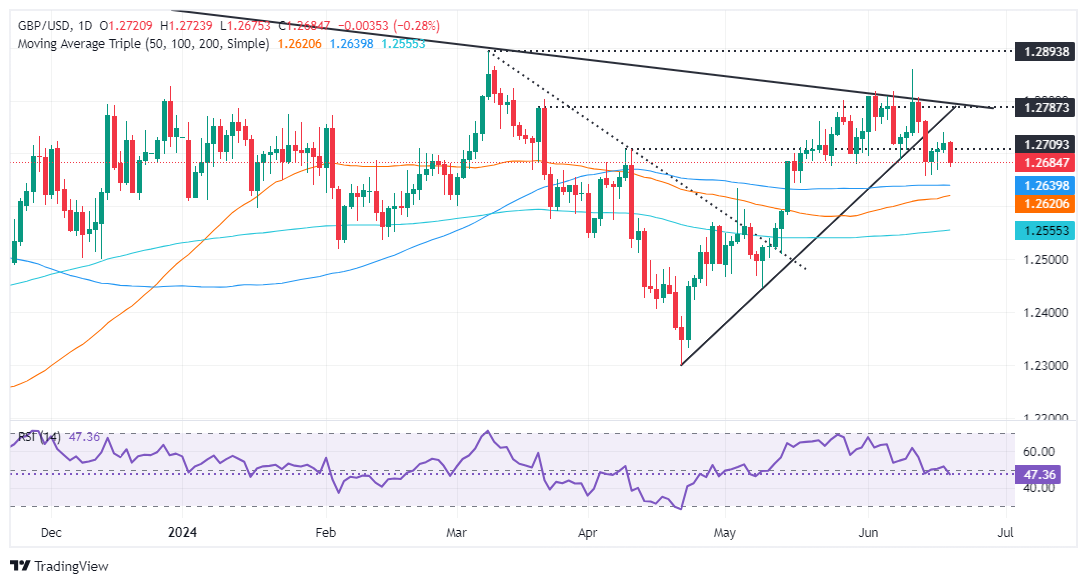
- Technical outlook shows neutral to upward bias, with critical support at 1.2643/38.
- Resistance levels to watch: 1.2700, 1.2739, and 1.2800. Support levels include 1.2619, 1.2600, and 200-DMA at 1.2551.

The Pound Sterling collapsed during the North American session, below the 1.2700 figure after the Bank of England (BoE) decided to keep rates unchanged but hinted at a possible cut in the summer. The GBP/USD trades at 1.2677, down 0.30%.
GBP/USD Price Analysis: Technical outlook
From a technical perspective, the GBP/USD is neutral to upward biased, but as it approaches the confluence of the 100-day moving average (DMA) and the May 3 high turned support at around 1.2643/38, a pierce underneath that zone, would accelerate the downtrend, change the pair bias and challenge the 50-DMA at 1.2619. Further losses are seen underneath the atter at 1.2600, ahead of testing the 200-DMA at 1.2551.
On the other hand, if buyers lift the exchange rate above 1.2700, the GBP/USD might get to the current week's high of 1.2739. Once cleared, the next stop would be the already tested 1.2800 mark.
GBP/USD Price Action – Daily Chart
British Pound PRICE Today
The table below shows the percentage change of British Pound (GBP) against listed major currencies today. British Pound was the strongest against the Swiss Franc.
| USD | EUR | GBP | JPY | CAD | AUD | NZD | CHF | |
|---|---|---|---|---|---|---|---|---|
| USD | 0.13% | 0.29% | 0.35% | -0.12% | 0.00% | 0.03% | 0.74% | |
| EUR | -0.13% | 0.15% | 0.22% | -0.25% | -0.12% | -0.11% | 0.61% | |
| GBP | -0.29% | -0.15% | 0.06% | -0.39% | -0.27% | -0.26% | 0.45% | |
| JPY | -0.35% | -0.22% | -0.06% | -0.49% | -0.33% | -0.35% | 0.39% | |
| CAD | 0.12% | 0.25% | 0.39% | 0.49% | 0.11% | 0.13% | 0.85% | |
| AUD | -0.01% | 0.12% | 0.27% | 0.33% | -0.11% | 0.01% | 0.74% | |
| NZD | -0.03% | 0.11% | 0.26% | 0.35% | -0.13% | -0.01% | 0.72% | |
| CHF | -0.74% | -0.61% | -0.45% | -0.39% | -0.85% | -0.74% | -0.72% |
The heat map shows percentage changes of major currencies against each other. The base currency is picked from the left column, while the quote currency is picked from the top row. For example, if you pick the British Pound from the left column and move along the horizontal line to the US Dollar, the percentage change displayed in the box will represent GBP (base)/USD (quote).
Author

Christian Borjon Valencia
FXStreet
Markets analyst, news editor, and trading instructor with over 14 years of experience across FX, commodities, US equity indices, and global macro markets.


