GBP/USD Price Analysis: Extends corrective slide from 34-month tops, further below 1.3900 mark


  • A sudden pickup in the USD demand prompted some profit-taking around GBP/USD.
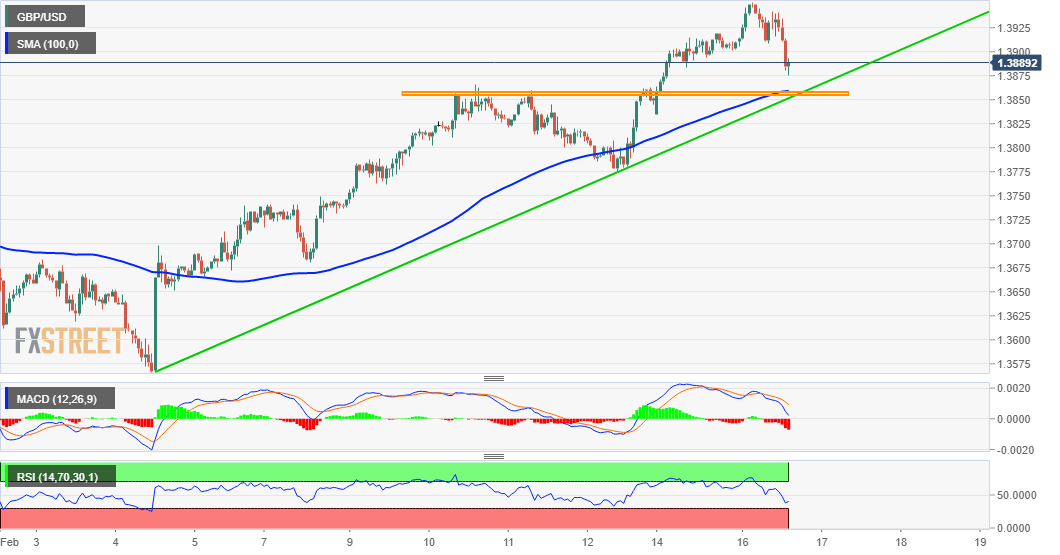
  • Break below 1.3860-55 confluence support might pave the way for further downside.
  • Mixed technical indicators warrant some caution before placing any aggressive bets.

The GBP/USD pair witnessed an intraday turnaround from 34-month tops and slipped below the 1.3900 round-figure mark during the early North American session.

The US dollar staged a solid rebound from three-week lows amid some strong follow-through upsurge in the US Treasury bond yields. This, in turn, was seen as a key factor that prompted some profit-taking around the GBP/USD pair.

Despite the intraday pullback of around 75 pips, the GBP/USD pair, so far, has managed to hold above the 1.3860-55 confluence support. The mentioned region comprises of 100-hour SMA and ascending trend-line, extending from monthly lows.

Meanwhile, technical indicators on the 1-hourly chart have been gaining bearish traction. However, oscillators on 4-hourly/daily charts are still holding comfortably in the positive territory and warrant caution for bearish traders.

Hence, it will be prudent to wait for a convincing break through the 1.3860-55 confluence support before confirming that the GBP/USD pair might have topped out in the near-term. This, in turn, will set the stage for additional weakness.

The GBP/USD pair might then turn vulnerable to accelerate the corrective slide towards the 1.3800 mark. Any further decline might still be seen as a buying opportunity and remain limited near the 1.3760-55 congestion zone.

On the flip side, the 1.3950 region, or near three-year tops set earlier this Tuesday, now becomes immediate resistance. A sustained strength beyond has the potential to lift the GBP/USD pair towards the key 1.4000 psychological mark.

GBP/USD 1-hourly chart

fxsoriginal

Technical levels to watch

GBP/USD

Overview
Today last price 1.3886
Today Daily Change -0.0020
Today Daily Change % -0.14
Today daily open 1.3906
 
Trends
Daily SMA20 1.3729
Daily SMA50 1.3602
Daily SMA100 1.336
Daily SMA200 1.3049
 
Levels
Previous Daily High 1.3919
Previous Daily Low 1.3834
Previous Weekly High 1.3866
Previous Weekly Low 1.368
Previous Monthly High 1.3759
Previous Monthly Low 1.3451
Daily Fibonacci 38.2% 1.3887
Daily Fibonacci 61.8% 1.3867
Daily Pivot Point S1 1.3854
Daily Pivot Point S2 1.3802
Daily Pivot Point S3 1.3769
Daily Pivot Point R1 1.3939
Daily Pivot Point R2 1.3971
Daily Pivot Point R3 1.4023


Share: Feed news

Information on these pages contains forward-looking statements that involve risks and uncertainties. Markets and instruments profiled on this page are for informational purposes only and should not in any way come across as a recommendation to buy or sell in these assets. You should do your own thorough research before making any investment decisions. FXStreet does not in any way guarantee that this information is free from mistakes, errors, or material misstatements. It also does not guarantee that this information is of a timely nature. Investing in Open Markets involves a great deal of risk, including the loss of all or a portion of your investment, as well as emotional distress. All risks, losses and costs associated with investing, including total loss of principal, are your responsibility. The views and opinions expressed in this article are those of the authors and do not necessarily reflect the official policy or position of FXStreet nor its advertisers. The author will not be held responsible for information that is found at the end of links posted on this page.

If not otherwise explicitly mentioned in the body of the article, at the time of writing, the author has no position in any stock mentioned in this article and no business relationship with any company mentioned. The author has not received compensation for writing this article, other than from FXStreet.

FXStreet and the author do not provide personalized recommendations. The author makes no representations as to the accuracy, completeness, or suitability of this information. FXStreet and the author will not be liable for any errors, omissions or any losses, injuries or damages arising from this information and its display or use. Errors and omissions excepted.

The author and FXStreet are not registered investment advisors and nothing in this article is intended to be investment advice.

Recommended content


Recommended content

Editors’ Picks

AUD/USD tumbles toward 0.6350 as Middle East war fears mount

AUD/USD tumbles toward 0.6350 as Middle East war fears mount

AUD/USD has come under intense selling pressure and slides toward 0.6350, as risk-aversion intensifies following the news that Israel retaliated with missile strikes on a site in Iran. Fears of the Israel-Iran strife translating into a wider regional conflict are weighing on the higher-yielding Aussie Dollar. 

AUD/USD News

USD/JPY breaches 154.00 as sell-off intensifies on Israel-Iran escalation

USD/JPY breaches 154.00 as sell-off intensifies on Israel-Iran escalation

USD/JPY is trading below 154.00 after falling hard on confirmation of reports of an Israeli missile strike on Iran, implying that an open conflict is underway and could only spread into a wider Middle East war. Safe-haven Japanese Yen jumped, helped by BoJ Governor Ueda's comments. 

USD/JPY News

Gold price jumps above $2,400 as MidEast escalation sparks flight to safety

Gold price jumps above $2,400 as MidEast escalation sparks flight to safety

Gold price has caught a fresh bid wave, jumping beyond $2,400 after Israel's retaliatory strikes on Iran sparked a global flight to safety mode and rushed flows into the ultimate safe-haven Gold. Risk assets are taking a big hit, as risk-aversion creeps into Asian trading on Friday. 

Gold News

WTI surges to $85.00 amid Israel-Iran tensions

WTI surges to $85.00 amid Israel-Iran tensions

Western Texas Intermediate, the US crude oil benchmark, is trading around $85.00 on Friday. The black gold gains traction on the day amid the escalating tension between Israel and Iran after a US official confirmed that Israeli missiles had hit a site in Iran.

Oil News

Dogwifhat price pumps 5% ahead of possible Coinbase effect

Dogwifhat price pumps 5% ahead of possible Coinbase effect

Dogwifhat price recorded an uptick on Thursday, going as far as to outperform its peers in the meme coins space. Second only to Bonk Inu, WIF token’s show of strength was not just influenced by Bitcoin price reclaiming above $63,000.

Read more

Forex MAJORS

Cryptocurrencies

Signatures