|

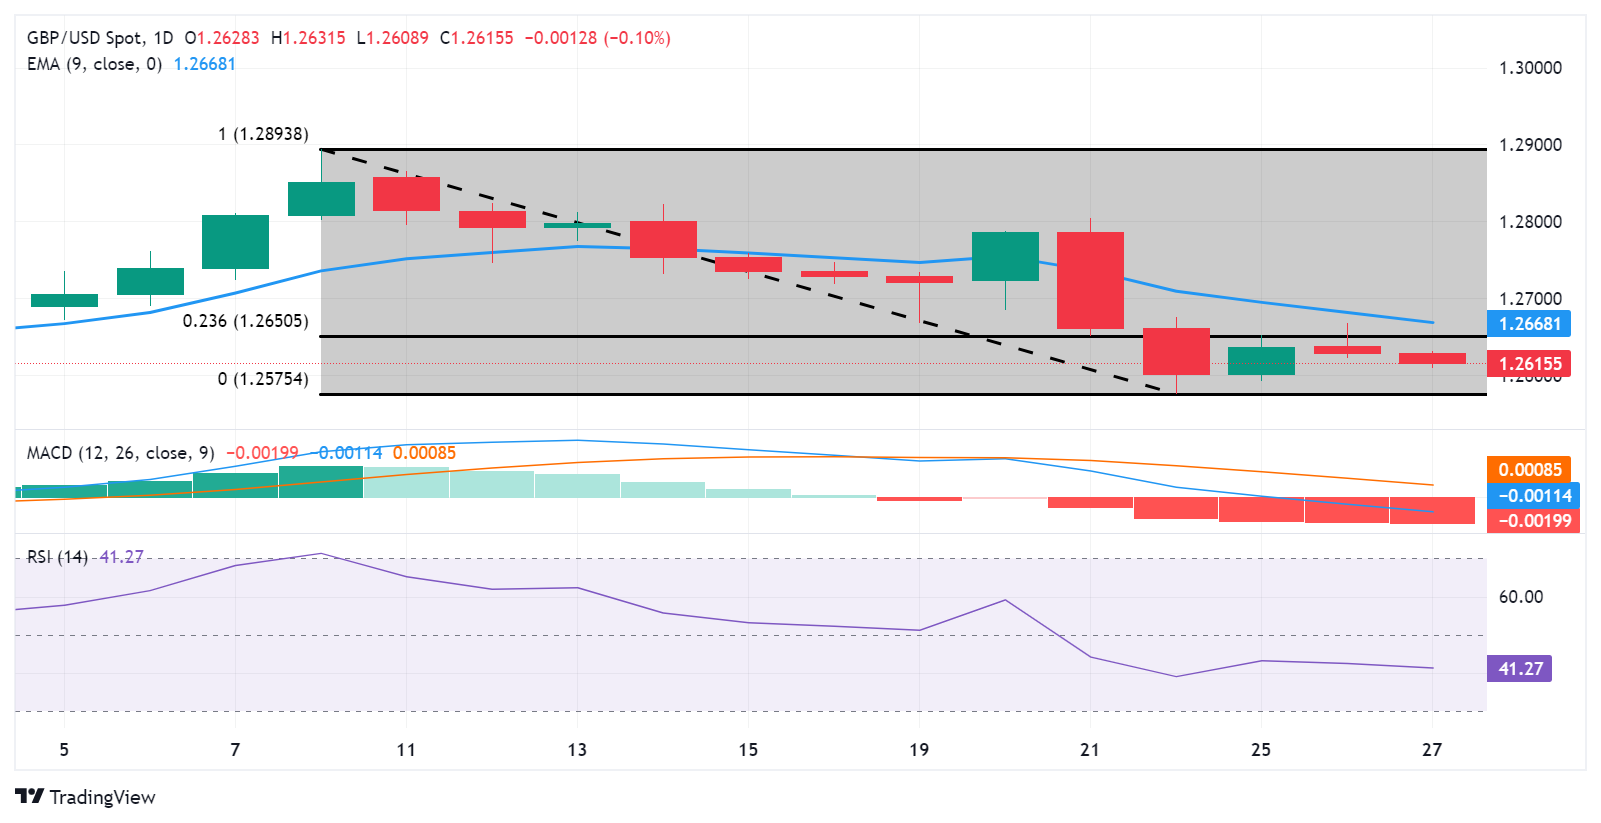
GBP/USD Price Analysis: Could test the level of 1.2600, next support at March’s low

  • GBP/USD could break the psychological support of the 1.2600 level to revisit March’s low at 1.2575.
  • Technical analysis suggests the bearish sentiment to test the major support of the 1.2550 level.
  • The resistance zone could be found around the 23.6% Fibonacci retracement level of 1.2650 level and the nine-day EMA at 1.2668.

GBP/USD extends its losses for the second consecutive day, depreciating to near 1.2620 during the Asian session on Wednesday. The pair could test the psychological support level of 1.2600. If this level is breached, it could prompt the pair to revisit March’s low at 1.2575.

The technical analysis of the GBP/USD pair suggests a bearish trend. The 14-day Relative Strength Index (RSI) is positioned below 50, indicating a bearish sentiment. Additionally, the Moving Average Convergence Divergence (MACD) confirms the bearish trend, as the MACD line is below the centerline and exhibits divergence below the signal line.

The bearish sentiment could influence the GBP/USD pair to test the major support of 1.2550 level, followed by February’s low of 1.2518.

On the upside, the GBP/USD pair could meet the major barrier at 23.6% Fibonacci retracement level of 1.2650 level. A breakthrough above this barrier could exert upward support for the pair to test the nine-day Exponential Moving Average (EMA) at 1.2668.

If the GBP/USD pair surpasses the latter, it could approach the psychological level of 1.2700.

GBP/USD: Daily Chart

GBP/USD

Overview
Today last price1.2617
Today Daily Change-0.0011
Today Daily Change %-0.09
Today daily open1.2628
 
Trends
Daily SMA201.272
Daily SMA501.268
Daily SMA1001.2645
Daily SMA2001.2591
 
Levels
Previous Daily High1.2668
Previous Daily Low1.2622
Previous Weekly High1.2804
Previous Weekly Low1.2575
Previous Monthly High1.2773
Previous Monthly Low1.2518
Daily Fibonacci 38.2%1.264
Daily Fibonacci 61.8%1.2651
Daily Pivot Point S11.2611
Daily Pivot Point S21.2594
Daily Pivot Point S31.2565
Daily Pivot Point R11.2657
Daily Pivot Point R21.2686
Daily Pivot Point R31.2703

Author

Akhtar Faruqui

Akhtar Faruqui is a Forex Analyst based in New Delhi, India. With a keen eye for market trends and a passion for dissecting complex financial dynamics, he is dedicated to delivering accurate and insightful Forex news and analysis.

More from Akhtar Faruqui
Share:

Editor's Picks

AUD/USD advances modestly, hovers around 0.7050

AUD/USD reverses part of Friday’s sharp decline and gyrates around the 0.7050 region ahead of the opening bell in Asia. The pair’s modest recovery comes amid humble losses in the Greenback, always amid the steady uncertainty on the geopolitical front. Moving forward, Westpac’s Consumer Confidence measure will be the salient release on Tuesday.

USD/JPY holds higher ground toward 160.50 despite 'Yentervention' fears

USD/JPY holds higher ground toward 160.50 in Monday's Asian trading, despite intervention fears. Japan’s revised GDP print, which confirmed that the economy lost momentum in the first quarter, weighs on the Japanese Yen. Meanwhile, Friday's upbeat US NFP report and fresh Israel-Iran attacks favor the US Dollar bulls, underpinning the currency pair.

Gold faces initial resistance near  $4,350

Gold manages to reclaim the $4,300 mark per troy ounce and above on Monday. The yellow metal’s small uptick comes on the back of modest losses in the US Dollar, while traders continue to follow geopolitical events in the Middle East and the likelihood of a tighter-for-longer Fed.

Why institutions prefer Solana over newer rivals for stablecoin adoption – Solstice CEO
The cryptocurrency industry has entered a new era spearheaded by stablecoins, real-world asset (RWA) tokenization, decentralized finance (DeFi), and Artificial Intelligence (AI) applications.
$1.75 trillion: Is SpaceX the most popular IPO in history, or the most engineered?

On June 12, the largest initial public offering (IPO) in history is set to hit the tape, and almost nobody is asking whether the price is right, because almost everybody already wants in.

The US economy defies the rules: 100 days into the Oil shock and the recession signal is still missing

More than three months after the start of the Iran war and the resulting disruption to global energy markets, the US economy continues to display remarkable resilience. The conflict has triggered a sharp rise in Oil prices, reignited inflationary pressures and fueled widespread concerns about a potential economic slowdown.