|

GBP/USD Price Analysis: Consolidates around 1.2700 after hitting 7-day low

  • GBP/USD slightly down for the second session in a row.
  • Technicals indicate losing buyer momentum as RSI approaches the 50-midline.
  • A drop below 1.2700 could push GBP/USD towards key moving averages near 1.2686 and potentially lower.
  • Upside seen above 1.2750, with buyers eyeing 1.2800.

The British Pound extended its losses for the second consecutive trading session against the US Dollar, following last Friday’s stellar jobs report from the US, which triggered the likelihood of a less dovish Federal Reserve. That and uncertainty on the upcoming Fed’s meeting would keep Cable pressured. Therefore, the GBP/USD trades at 1.2713, down 0.01%

GBP/USD Price Analysis: Technical outlook

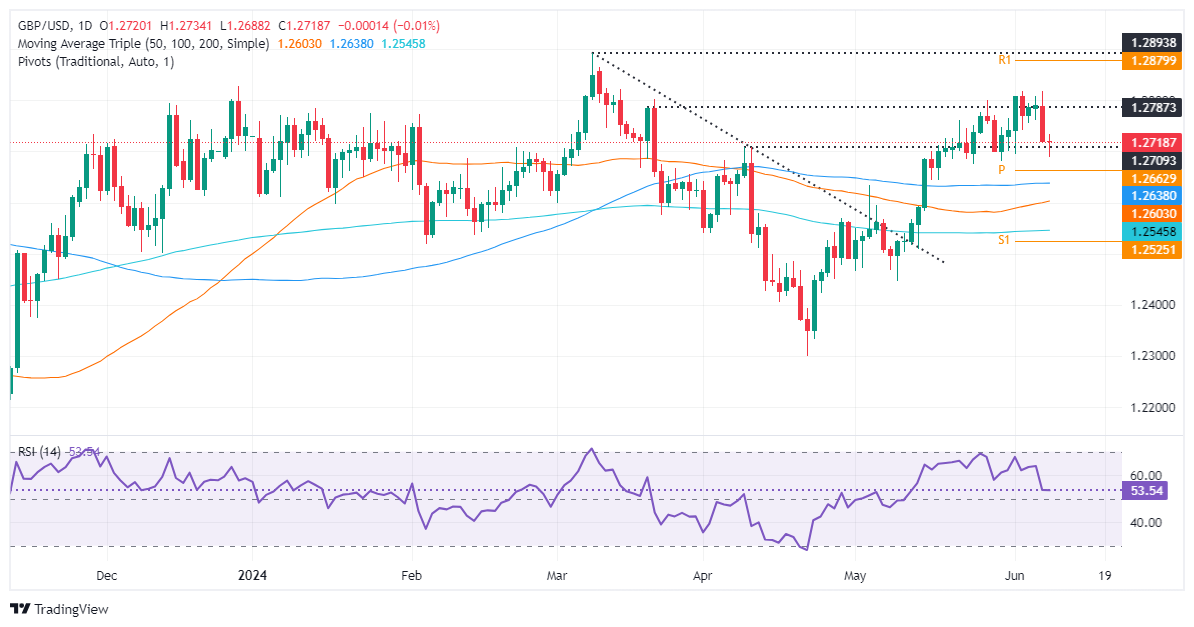
After struggling at around 1.2800 with key technical resistance levels, the GBP/USD tumbled below 1.2700 and printed a new seven-day low of 1.2687 before recovering some ground.

Although momentum still favors buyers, the Relative Strength Index (RSI) dropped sharply towards crossing the 50-midline, hinting that buyers are losing momentum. Nevertheless, Monday’s price action seems to form a ‘dragonfly doji,’ a bullish candlestick.

If GBP/USD reclaims 1.2750, it will be possible to challenge the June 7 high of 1.2813. Once cleared, the next resistance line will be 1.2850, followed by 1.2900.

Conversely, if GBP/USD prints a daily close below 1.2700, that would sponsor a leg-down toward the confluence of the 100-day moving average (DMA) at around 1.2686, ahead of the 50 and 200-DMAs each at 1.2602 and 1.2543, respectively.

GBP/USD Price Action – Daily Chart

GBP/USD

Overview
Today last price1.2718
Today Daily Change-0.0002
Today Daily Change %-0.02
Today daily open1.272
 
Trends
Daily SMA201.2718
Daily SMA501.26
Daily SMA1001.2638
Daily SMA2001.2545
 
Levels
Previous Daily High1.2818
Previous Daily Low1.2716
Previous Weekly High1.2818
Previous Weekly Low1.2695
Previous Monthly High1.2801
Previous Monthly Low1.2446
Daily Fibonacci 38.2%1.2755
Daily Fibonacci 61.8%1.2779
Daily Pivot Point S11.2685
Daily Pivot Point S21.2649
Daily Pivot Point S31.2583
Daily Pivot Point R11.2787
Daily Pivot Point R21.2853
Daily Pivot Point R31.2889

Author

Christian Borjon Valencia

Markets analyst, news editor, and trading instructor with over 14 years of experience across FX, commodities, US equity indices, and global macro markets.

More from Christian Borjon Valencia
Share:

Editor's Picks

GBP/USD loses momentum, flirts with 1.3200

GBP/USD is struggling to maintain its positive bias on Thursday, retreating toward the 1.3200 region in response to the pick in the buying interest around the Greenback. That said, Cable remains under scrutiny as cautious market sentiment keeps investors focused on the US-Iran conflict and political effervescence in the UK.

EUR/USD trims gains, challenges 1.1400

EUR/USD now gives away part of its earlier advance, receding toward the 1.1400 contention zone on Thursday. Meanwhile, the pair’s recovery comes amid extra losses in the US Dollar, at the time when while investors continue to monitor developments in the Middle East and sentiment surrounding global technology stocks.

Gold remains bid and close to $4,100

Gold accelerates its recovery and approaches the key $4,000 mark per troy ounce at the end of the week, adding to Thursday’s advance. However, expectations for a hawkish Fed remain steady and keep the yellow metal’s potential upside contained.

Crypto Today: Bitcoin at $60,000, Ethereum at $1,500, and XRP at $1 face a make-or-break test

Bitcoin (BTC), Ethereum (ETH), and Ripple (XRP) are trading in the red on Friday after three consecutive days of losses, testing their respective make-or-break support levels.

Week ahead – NFP report to challenge Dollar strength and the hawkish Fed

Dollar strength dominates markets, as the hawkish Fed overshadows geopolitics and lower oil prices. NFP week could drive September Fed hike expectations and boost market volatility. The euro lacks fresh bullish catalysts, all eyes on the preliminary inflation report and the ECB Forum.

Regime change: Inside Kevin Warsh's first move to make the Fed unreadable on purpose

The rate did not move. That was the least interesting thing about Kevin Warsh's first meeting in charge of the Fed. The FOMC held its benchmark at 3.50%-3.75% for the fourth straight meeting, exactly as priced, and then the new chair used his first press conference to dismantle the machinery the market has leaned on for a decade.