GBP/USD Price Analysis: Clings to 100-HMA above 1.2000 with eyes on UK PMI


  • GBP/USD struggles for clear directions after tepid week-start, fails to extend Friday’s bounce off multi-day low.
  • Sluggish oscillators, key HMAs challenge bulls ahead of 13-day-old resistance line.
  • Bears need sustained trading below 1.1920-15 to retake control.

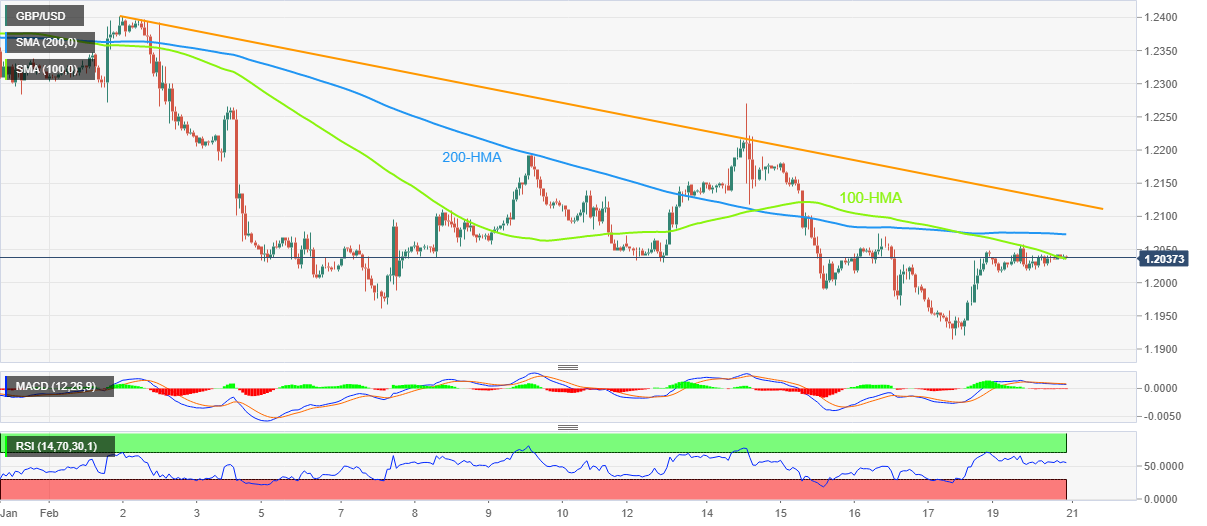
GBP/USD remains sidelined near 1.2040 during the early hours of Tuesday’s Asian session, extending Monday’s inaction.

In doing so, the Cable pair seesaws around the 100-Hour Moving Average (HMA) amid the trader’s cautious mood ahead of the first readings of the UK Purchasing Managers Indexes (PMI) for February.

Not only the 100-HMA level surrounding 1.2040 but the 200-HMA level surrounding 1.2075 also challenges the GBP/USD pair buyers.

Following that, a downward-sloping resistance line from February 02, close to 1.2125 at the latest, will be important to watch as a break of which could convince GBP/USD buyers to challenge the monthly high surrounding the 1.2400 threshold. During the run-up, the previous weekly high near 1.2270 may act as an intermediate halt.

Meanwhile, the 1.2000 psychological maget precedes the 1.1960 support to restrict short-term GBP/USD downside.

However, the recent low near 1.1920-15 joins an upward-sloping support line from mid-November 2022 to act as a tough nut to crack for the GBP/USD bears to conquer.

To sum up, GBP/USD remains tight-lipped ahead of the key UK data. However, the sluggish oscillators and multiple hurdles to the north keep sellers hopeful.

GBP/USD: Hourly chart

Trend: Further downside expected

Additional important levels

Overview
Today last price 1.2038
Today Daily Change -0.0006
Today Daily Change % -0.05%
Today daily open 1.2044
 
Trends
Daily SMA20 1.2197
Daily SMA50 1.2174
Daily SMA100 1.1903
Daily SMA200 1.194
 
Levels
Previous Daily High 1.2049
Previous Daily Low 1.1915
Previous Weekly High 1.227
Previous Weekly Low 1.1915
Previous Monthly High 1.2448
Previous Monthly Low 1.1841
Daily Fibonacci 38.2% 1.1998
Daily Fibonacci 61.8% 1.1966
Daily Pivot Point S1 1.1956
Daily Pivot Point S2 1.1869
Daily Pivot Point S3 1.1822
Daily Pivot Point R1 1.209
Daily Pivot Point R2 1.2137
Daily Pivot Point R3 1.2224


Share: Feed news

Information on these pages contains forward-looking statements that involve risks and uncertainties. Markets and instruments profiled on this page are for informational purposes only and should not in any way come across as a recommendation to buy or sell in these assets. You should do your own thorough research before making any investment decisions. FXStreet does not in any way guarantee that this information is free from mistakes, errors, or material misstatements. It also does not guarantee that this information is of a timely nature. Investing in Open Markets involves a great deal of risk, including the loss of all or a portion of your investment, as well as emotional distress. All risks, losses and costs associated with investing, including total loss of principal, are your responsibility. The views and opinions expressed in this article are those of the authors and do not necessarily reflect the official policy or position of FXStreet nor its advertisers. The author will not be held responsible for information that is found at the end of links posted on this page.

If not otherwise explicitly mentioned in the body of the article, at the time of writing, the author has no position in any stock mentioned in this article and no business relationship with any company mentioned. The author has not received compensation for writing this article, other than from FXStreet.

FXStreet and the author do not provide personalized recommendations. The author makes no representations as to the accuracy, completeness, or suitability of this information. FXStreet and the author will not be liable for any errors, omissions or any losses, injuries or damages arising from this information and its display or use. Errors and omissions excepted.

The author and FXStreet are not registered investment advisors and nothing in this article is intended to be investment advice.

Recommended content


Recommended content

Editors’ Picks

EUR/USD retreats toward 1.0850 on modest USD recovery

EUR/USD retreats toward 1.0850 on modest USD recovery

EUR/USD stays under modest bearish pressure and trades in negative territory at around 1.0850 after closing modestly lower on Thursday. In the absence of macroeconomic data releases, investors will continue to pay close attention to comments from Federal Reserve officials.

EUR/USD News

GBP/USD holds above 1.2650 following earlier decline

GBP/USD holds above 1.2650 following earlier decline

GBP/USD edges higher after falling to a daily low below 1.2650 in the European session on Friday. The US Dollar holds its ground following the selloff seen after April inflation data and makes it difficult for the pair to extend its rebound. Fed policymakers are scheduled to speak later in the day.

GBP/USD News

Gold climbs to multi-week highs above $2,400

Gold climbs to multi-week highs above $2,400

Gold gathered bullish momentum and touched its highest level in nearly a month above $2,400. Although the benchmark 10-year US yield holds steady at around 4.4%, the cautious market stance supports XAU/USD heading into the weekend.

Gold News

Chainlink social dominance hits six-month peak as LINK extends gains

Chainlink social dominance hits six-month peak as LINK extends gains

Chainlink (LINK) social dominance increased sharply on Friday, exceeding levels seen in the past six months, along with the token’s price rally that started on Wednesday. 

Read more

Week ahead: Flash PMIs, UK and Japan CPIs in focus – RBNZ to hold rates

Week ahead: Flash PMIs, UK and Japan CPIs in focus – RBNZ to hold rates

After cool US CPI, attention shifts to UK and Japanese inflation. Flash PMIs will be watched too amid signs of a rebound in Europe. Fed to stay in the spotlight as plethora of speakers, minutes on tap.

Read more

Forex MAJORS

Cryptocurrencies

Signatures