GBP/USD Price Analysis: Climbs to 4-week high, buyers target 1.2900
- GBP/USD continued to edge higher for eight straight days,
- US economic docket led by Fed Chair Powell and inflation data to lay GBP/USD’s path.
- The pair is bullish-biased, with buyers set to test 1.2900.

The Pound Sterling begins the week on a higher note and posted gains of more than 0.20%, as the Greenback continued to edge lower, amid increasing expectations that the Federal Reserve could cut borrowing costs in September. A busy week in the US docket will feature Fed Chair Jerome Powell's speeches at the US Congress, while inflation data on Wednesday will lay the path for the upcoming Fed decision. The GBP/USD trades at 1.2844 at around four-week highs.
GBP/USD Price Analysis: Technical outlook
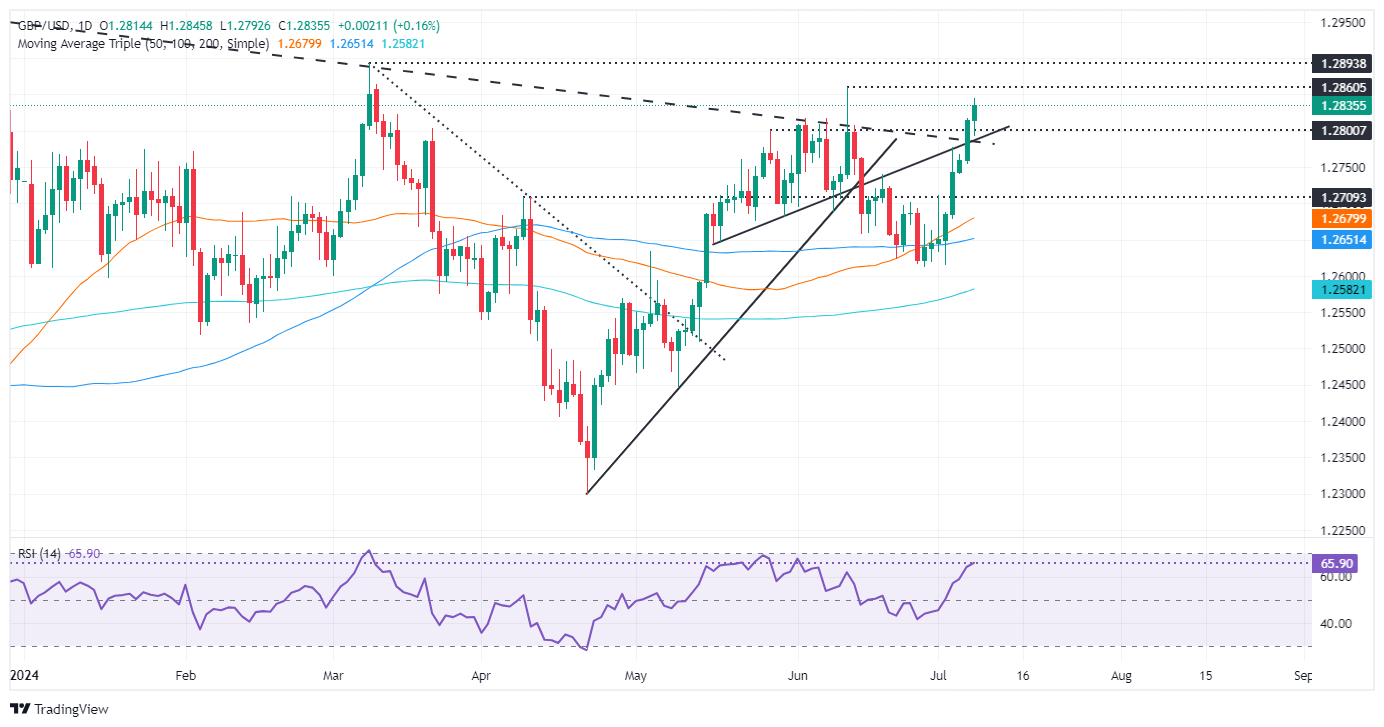
From a technical perspective, the GBP/USD pair has made a significant move. It has broken a downslope resistance trendline that dates to the August 2023 highs. This trendline has now become a support level, following the pair's clearance of the 1.2750 psychological level.
Momentum suggests that buyers could push the exchange rate higher, as depicted by the Relative Strength Index (RSI) in bullish territory.
This would put the year-to-date (YTD) high of 1.2893 back into play, and further Cable’s strength could push the pair above 1.2900, with buyers setting their sights on the July 27, 2023, high of 1.2995.
For a bearish continuation, the first support to be taken would be the 50-day moving average (DMA) at 1.2678, followed by the 100-DMA at 1.2650, and the latest cycle low being the Jun 27 low of 1.2612.
GBP/USD Price Action – Daily Chart
British Pound PRICE Today
The table below shows the percentage change of British Pound (GBP) against listed major currencies today. British Pound was the strongest against the Swiss Franc.
| USD | EUR | GBP | JPY | CAD | AUD | NZD | CHF | |
|---|---|---|---|---|---|---|---|---|
| USD | 0.05% | -0.16% | -0.11% | -0.09% | 0.03% | -0.04% | 0.13% | |
| EUR | -0.05% | -0.01% | 0.16% | 0.17% | 0.14% | 0.25% | 0.41% | |
| GBP | 0.16% | 0.01% | 0.14% | 0.20% | 0.15% | 0.26% | 0.42% | |
| JPY | 0.11% | -0.16% | -0.14% | 0.02% | 0.16% | 0.23% | 0.29% | |
| CAD | 0.09% | -0.17% | -0.20% | -0.02% | 0.08% | 0.06% | 0.24% | |
| AUD | -0.03% | -0.14% | -0.15% | -0.16% | -0.08% | 0.11% | 0.27% | |
| NZD | 0.04% | -0.25% | -0.26% | -0.23% | -0.06% | -0.11% | 0.16% | |
| CHF | -0.13% | -0.41% | -0.42% | -0.29% | -0.24% | -0.27% | -0.16% |
The heat map shows percentage changes of major currencies against each other. The base currency is picked from the left column, while the quote currency is picked from the top row. For example, if you pick the British Pound from the left column and move along the horizontal line to the US Dollar, the percentage change displayed in the box will represent GBP (base)/USD (quote).
Author

Christian Borjon Valencia
FXStreet
Markets analyst, news editor, and trading instructor with over 14 years of experience across FX, commodities, US equity indices, and global macro markets.


