• GBP/USD rises, rebounding from 1.2474 amid rumors impacting the US Dollar.
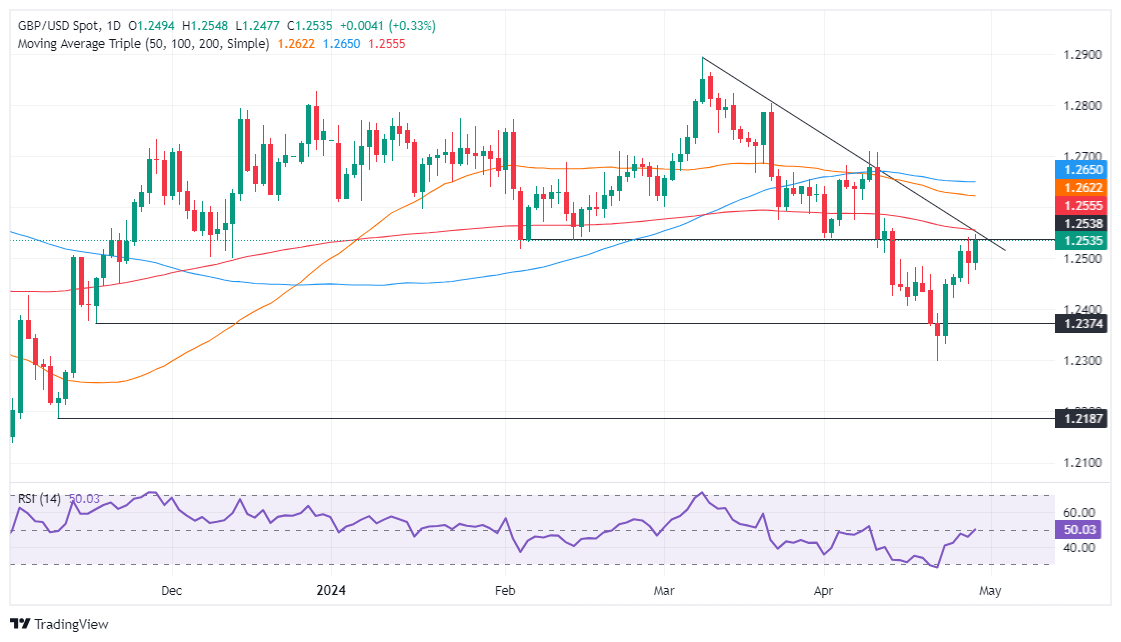
  • Currently, GBP/USD tests the 200-day moving average at 1.2555, showing a neutral to slight bearish outlook.
  • Breaking above the 200-DMA may target 1.2600, with potential further gains to 1.2621 and 1.2645.
  • Failure to exceed the 200-DMA could prompt a retest of the 1.2500 support.

The Pound Sterling advanced sharply against the US Dollar in early trading during Monday’s North American session after hitting a daily low of 1.2474. Rumors of an intervention by Japanese authorities to propel the Japanese Yen (JPY) weighed on the Greenback, which is tumbling against most G8 FX currencies. Therefore, the GBP/USD trades at 1.2534, gaining 0.36%.

GBP/USD Price Analysis:  Technical outlook

From a technical standpoint, the GBP/USD is neutral-biased, though tilted to the downside. It remains below the key 200-day moving average (DMA) at 1.2555, which delineates an asset's bullishness or bearishness. However, buyers are gathering momentum as the Relative Strength Index (RSI) punches above the 50-midline level.

With that context, if buyers achieve a daily close above the 200-DMA, that will expose the 1.2600 figure. Further upside is seen past the 50-DMA at 1.2621, followed by the 100-DMA at 1.2645. Once those levels are surpassed, the 1.2700 mark is up next.

Conversely, failure at the 200-DMA adds pressure on Sterling, which could drag the GBP/USD exchange rate beneath the 1.2500 mark. A breach of the latter will expose the April 24 low at 1.2422, followed by the April 22 low at 1.2299.

GBP/USD Price Action – Daily Chart

GBP/USD

Overview
Today last price 1.2532
Today Daily Change 0.0038
Today Daily Change % 0.30
Today daily open 1.2494
 
Trends
Daily SMA20 1.2517
Daily SMA50 1.2624
Daily SMA100 1.265
Daily SMA200 1.2557
 
Levels
Previous Daily High 1.2542
Previous Daily Low 1.2449
Previous Weekly High 1.2542
Previous Weekly Low 1.23
Previous Monthly High 1.2894
Previous Monthly Low 1.2575
Daily Fibonacci 38.2% 1.2485
Daily Fibonacci 61.8% 1.2507
Daily Pivot Point S1 1.2448
Daily Pivot Point S2 1.2402
Daily Pivot Point S3 1.2355
Daily Pivot Point R1 1.2541
Daily Pivot Point R2 1.2588
Daily Pivot Point R3 1.2633


Share: Feed news

Information on these pages contains forward-looking statements that involve risks and uncertainties. Markets and instruments profiled on this page are for informational purposes only and should not in any way come across as a recommendation to buy or sell in these assets. You should do your own thorough research before making any investment decisions. FXStreet does not in any way guarantee that this information is free from mistakes, errors, or material misstatements. It also does not guarantee that this information is of a timely nature. Investing in Open Markets involves a great deal of risk, including the loss of all or a portion of your investment, as well as emotional distress. All risks, losses and costs associated with investing, including total loss of principal, are your responsibility. The views and opinions expressed in this article are those of the authors and do not necessarily reflect the official policy or position of FXStreet nor its advertisers. The author will not be held responsible for information that is found at the end of links posted on this page.

If not otherwise explicitly mentioned in the body of the article, at the time of writing, the author has no position in any stock mentioned in this article and no business relationship with any company mentioned. The author has not received compensation for writing this article, other than from FXStreet.

FXStreet and the author do not provide personalized recommendations. The author makes no representations as to the accuracy, completeness, or suitability of this information. FXStreet and the author will not be liable for any errors, omissions or any losses, injuries or damages arising from this information and its display or use. Errors and omissions excepted.

The author and FXStreet are not registered investment advisors and nothing in this article is intended to be investment advice.

Recommended content


Recommended content

Editors’ Picks

EUR/USD consolidates below 1.0900 following Wednesday's rally

EUR/USD consolidates below 1.0900 following Wednesday's rally

EUR/USD trades in a tight range below 1.0900 after registering impressive gains on Wednesday. The US Dollar struggles to stage a rebound following the CPI-inspired selloff as investors await mid-tier data releases and comments from Fed officials.

EUR/USD News

GBP/USD corrects lower after testing 1.2700

GBP/USD corrects lower after testing 1.2700

Following Wednesday's upsurge, GBP/USD stretched higher and touched a fresh multi-week high at 1.2700 in the Asian session on Thursday. With the market focus shifting to US Jobless Claims data, the pair corrects lower in the European trading hours. 

GBP/USD News

Gold price drifts higher as US CPI inflation fuels Fed rate cuts

Gold price drifts higher as US CPI inflation fuels Fed rate cuts

The Gold price gains traction amid the weaker US Dollar on Thursday. The recent CPI report showed inflation in the US slowed in April, prompting market players to increase their bets on the US Fed rate cuts this year.

Gold News

Bitcoin likely to return to all-time high of $73,949, QCP Capital says

Bitcoin likely to return to all-time high of $73,949, QCP Capital says

Bitcoin (BTC) price is likely to rally back to $74,000 in the coming weeks, it's all-time high reached in March, riding on three bullish catalysts, according to crypto trading firm QCP Capital.

Read more

Dow Jones Industrial Average soars 350 points, sets new all-time high as rate cut hopes surge

Dow Jones Industrial Average soars 350 points, sets new all-time high as rate cut hopes surge

The Dow Jones Industrial Average clipped into a fresh all-time high on Wednesday, gaining almost nine-tenths of a percent during the US market session after US Consumer Price Index inflation slipped further back.

Read more

Forex MAJORS

Cryptocurrencies

Signatures