GBP/USD Price Analysis: Bulls have the upper hand above 200 DMA, US NFP awaited
- GBP/USD oscillates in a narrow trading band just below its highest level since June.
- The overnight breakout above the 200-day SMA supports prospects for further gains.
- Bulls, however, prefer to wait for the crucial US NFP report before placing fresh bets.

The GBP/USD pair consolidates its recent gains to the highest level since June and oscillates in a range, below the 1.2300 mark through the first half of the European session on Friday. The technical bias, meanwhile, remains tilted in favour of bulls and supports prospects for a further near-term appreciating move.
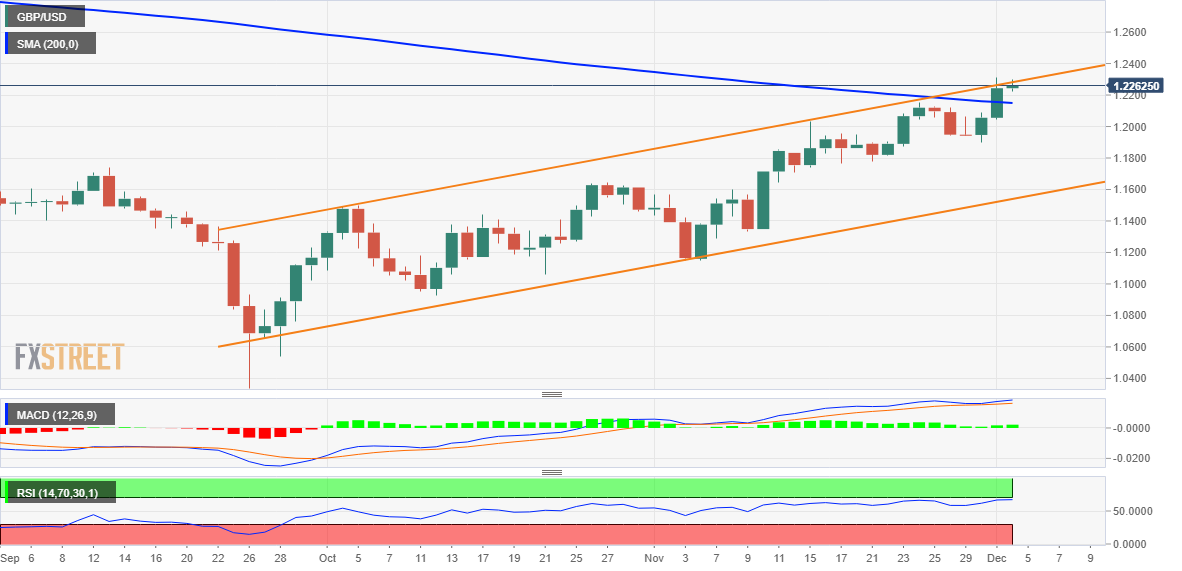
The overnight sustained strength and acceptance above a technically significant 200-day Simple Moving Average (SMA) for the first time in 2022 could be seen as a fresh trigger for bullish traders. Furthermore, the recent move up since late September has been along an ascending channel, which further points to a well-established short-term positive trend. Furthermore, the break and close above the key 1.2150 level could now mark evidence of a longer-term change in trend from bearish to bullish as it will the thrid time a down trend line has been broken and redrawn from the February 2022 highs. A rebreak of the primary trend three times suggests that trend has now reversed. Although not a definitive guarantee or reversal it is further evidence supporting a more extended bullish outlook.
Moreover, oscillators on the daily chart are holding comfortably in the positive territory and are still far from being in the overbought zone. The GBP/USD pair, however, remains capped near the trend-channel resistance as traders prefer to move to the sidelines ahead of the release of the closely-watched US monthly jobs report (FMP). Nevertheless, pull backs and dips may be profitably bought into.
A corrective pullback might now find decent support near the 1.2200 mark. Any further downfall could be seen as a buying opportunity and remain limited near the 1.2150 region (200 DMA). The latter should act as a pivotal point for short-term traders, which if broken decisively will negate the near-term positive outlook for the GBP/USD pair. It is not till you get down to the base of the channel at 1.1600, however, that price reaches a make-or-break point, with penetration below suggesting the downtrend may still have some more impetus left in it, and a revisit of the 1.0600-1.0800 region. Though this now seems increasingly unlikely.
GBP/USD daily chart
Key levels to watch
Author

Haresh Menghani
FXStreet
Haresh Menghani is a detail-oriented professional with 10+ years of extensive experience in analysing the global financial markets.


