|

GBP/USD Price Analysis: Bears press 1.3700 critical daily support

  • GBP/USD bears move in to take on critical daily support. 
  • Bears eye a break of 1.3700 for a way to 1.3640s. 

GBP/USD is on the verge of a break of critical support according to the following top-down analysis that illustrates the market structure across the daily, 4-hour and 1-hour charts. 

GBP/USD daily chart
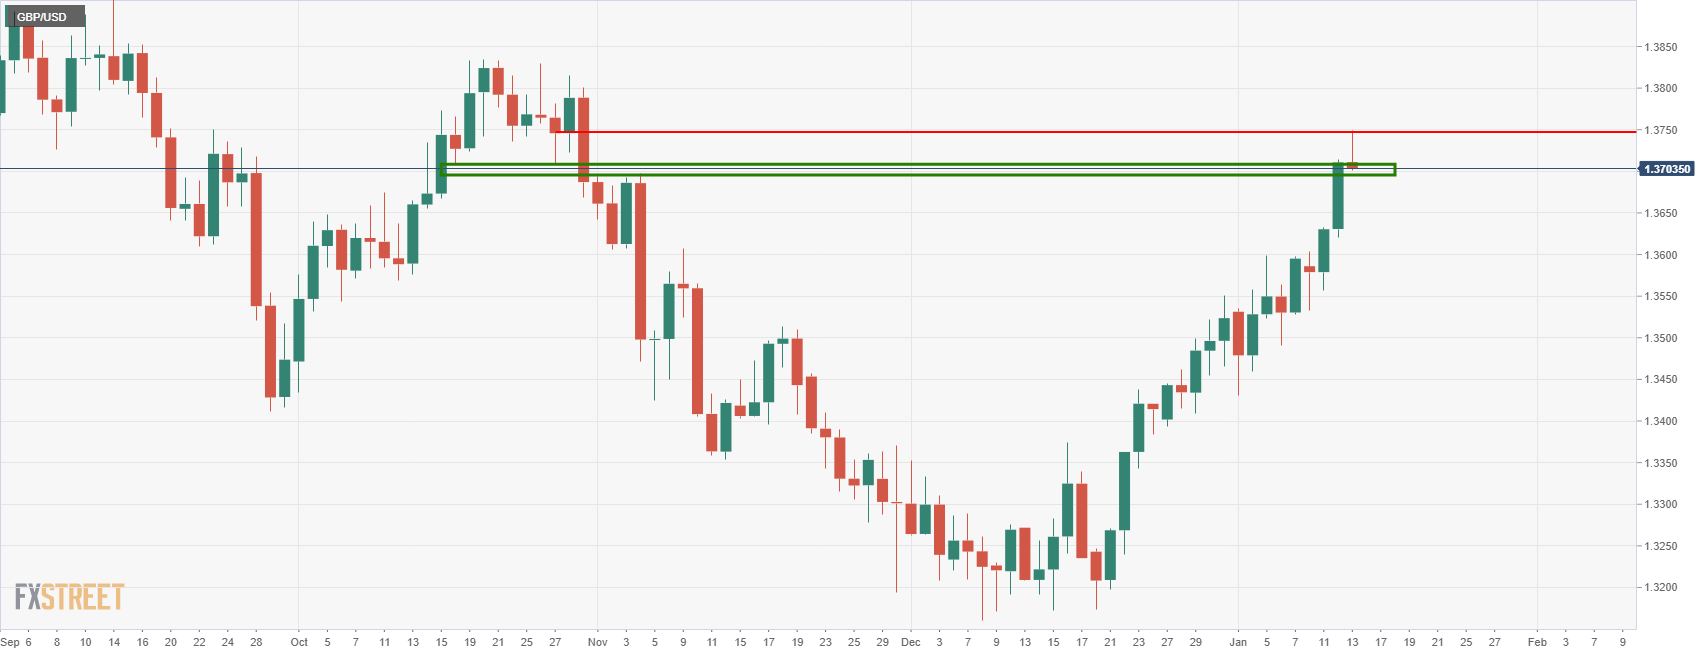
The daily chart shows that the price has run-up to a critical area and level of resistance between 1.3700 and 1.3750. A downside correction could be on the cards on a break below 1.37 as follows:

GBP/USD H4 chart
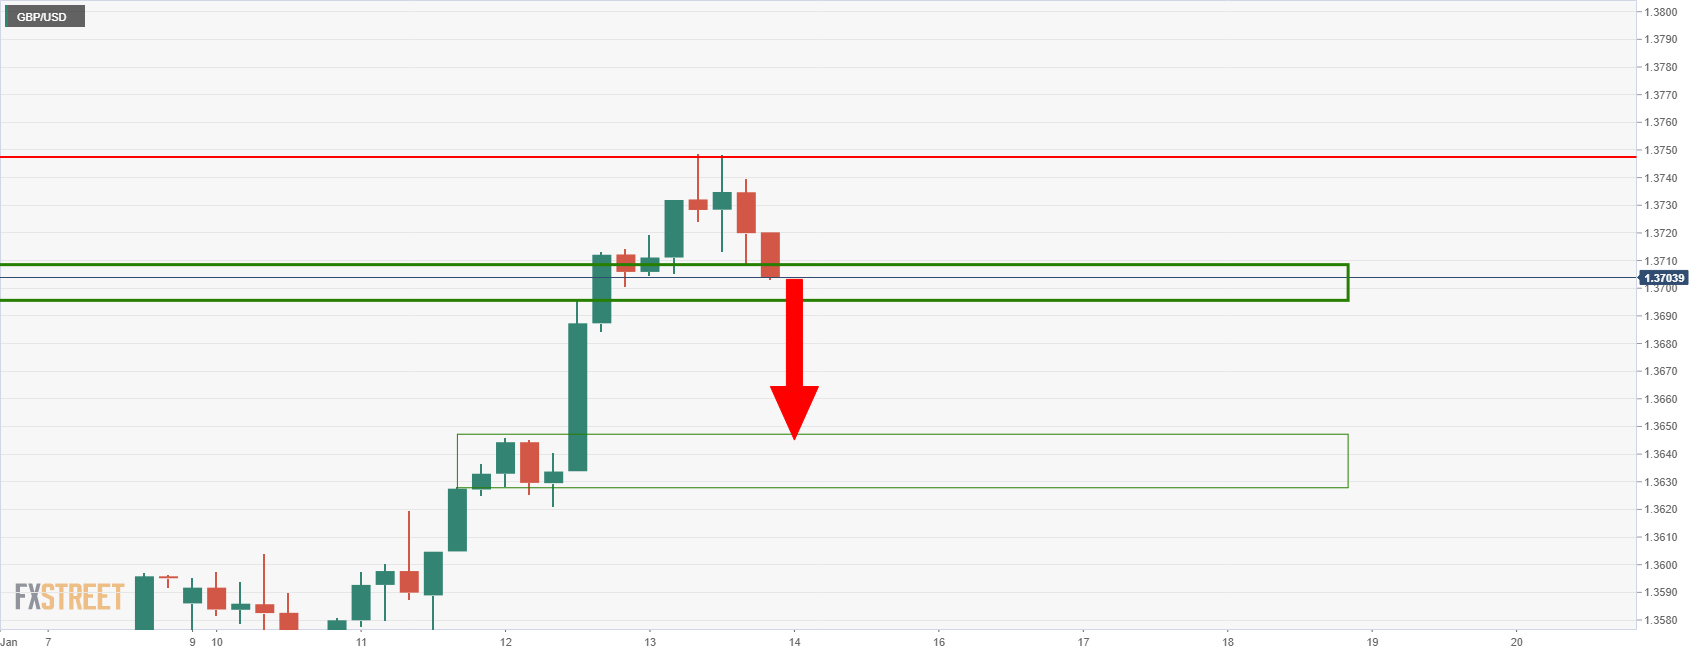
The 4-hour chart is on showing that the price is on the verge of a break of this current support and in doing so, there is room to the 1.3640s. 

GBP/USD H1 chart
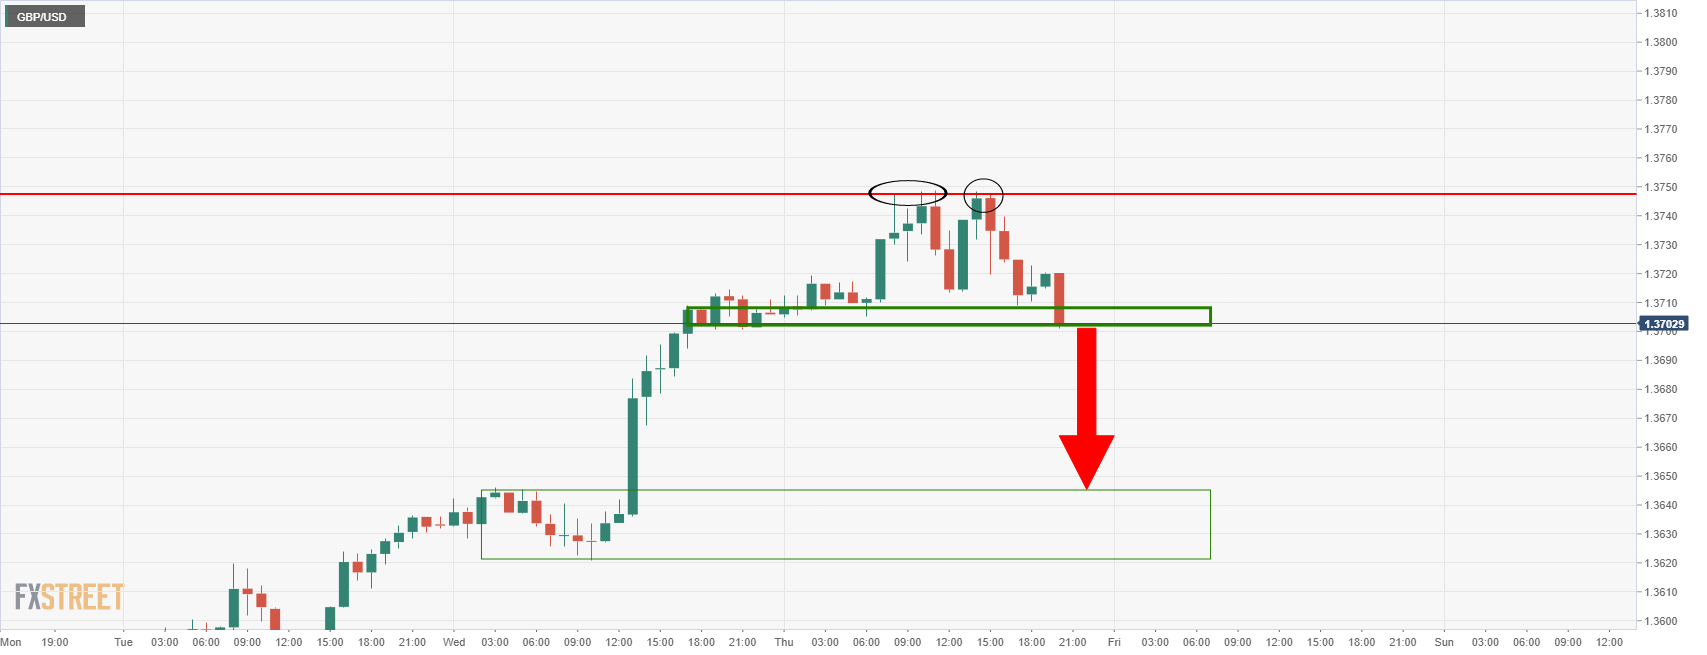
The hourly chart offers a double top confirmation as well.

Author

Ross J Burland

Ross J Burland, born in England, UK, is a sportsman at heart. He played Rugby and Judo for his county, Kent and the South East of England Rugby team.


More from Ross J Burland
Share:

Editor's Picks

CLARITY Act approval odds sink fast ahead of Congressional hearing
The United States (US) House Financial Services Committee’s Subcommittee on Digital Assets, Financial Technology, and Artificial Intelligence (AI) is holding a hearing titled “Building the Future of Finance: How the CLARITY Act Unlocks Innovation” on Friday.
Week ahead – Could technology earnings revive equities as geopolitical risks linger?

Oil prices rise, but the dollar posts losses as Middle East tensions persist. US earnings, the ECB and UK newsflow dominate next week’s agenda. US equity markets face a pivotal test as focus shifts to technology earnings.

-0.4%: Why the biggest CPI drop since 2020 couldn't buy back a single cut

The June CPI fell 0.4% on the month, the largest one-month decline since April 2020, dragging the annual rate to 3.5% from May's 4.2% and snapping a three-month acceleration streak. Core prices went nowhere, flat on the month and down to 2.6% YoY, both under consensus.