- Resurgent USD demand prompted some aggressive selling around GBP/USD on Friday.
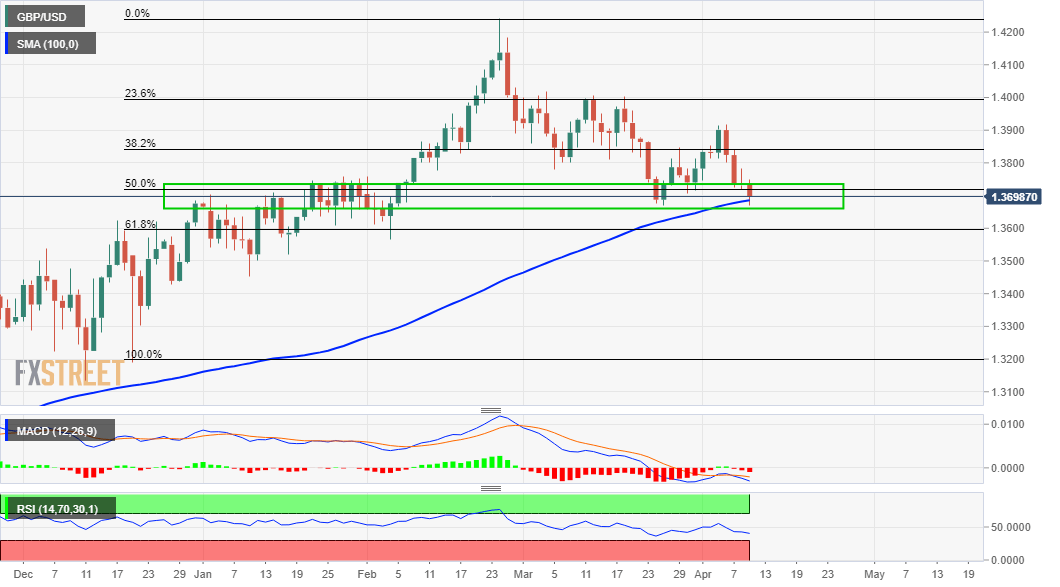
- The sharp intraday decline managed stalled near 100-DMA, around the 1.3670 region.
- The set-up still favours bearish traders and supports prospects for further weakness.
The GBP/USD pair witnessed some aggressive selling on the last trading day of the week and tumbled to over two-month lows, around the 1.3670 region. A strong pickup in the US Treasury bond yields assisted the US dollar to stage a solid rebound from two-week lows. This, in turn, was seen as a key factor that exerted some heavy downward pressure on the GBP/USD pair.
Sustained weakness below the 1.3700 mark further aggravated the intraday bearish pressure. The GBP/USD pair, however, managed to find some support near the 100-day SMA and recovered around 50 pips, though lacked any follow-through. The pair now seems to have stabilized near the 50% Fibonacci level of the 1.3188-1.4243 strong move up. This marks a congestion zone on the way up to multi-year tops and should now act as a pivotal point for traders.
Meanwhile, technical indicators on the daily chart maintained their bearish bias and are still far from being in the oversold territory. The set-up favours bearish traders and supports prospects for additional near-term weakness. The GBP/USD pair remains vulnerable to break below the 1.3600 round-figure mark and drop to test the 61.8% Fibo. level, around the 1.3580-70 region. This nears the February monthly swing lows and might limit any further decline.
That said, some follow-through selling would mark a fresh bearish breakdown and drag the GBP/USD pair further towards the 1.3500 psychological mark. The downward trajectory could get extended towards YTD lows, around mid-1.3400s.
On the flip side, the 1.3730 area now seems to act as immediate resistance. Any subsequent move up might be seen as a selling opportunity and remain capped near the overnight swing highs, around the 1.3780 region. This is closely followed by the 1.3800 mark and the 38.2% Fibo. level, around the 1.3820-25 region. A sustained move beyond will negate the bearish outlook and prompt some short-covering move, pushing the GBP/USD pair to the 1.3900 mark.
GBP/USD daily chart
Technical levels to watch
Information on these pages contains forward-looking statements that involve risks and uncertainties. Markets and instruments profiled on this page are for informational purposes only and should not in any way come across as a recommendation to buy or sell in these assets. You should do your own thorough research before making any investment decisions. FXStreet does not in any way guarantee that this information is free from mistakes, errors, or material misstatements. It also does not guarantee that this information is of a timely nature. Investing in Open Markets involves a great deal of risk, including the loss of all or a portion of your investment, as well as emotional distress. All risks, losses and costs associated with investing, including total loss of principal, are your responsibility. The views and opinions expressed in this article are those of the authors and do not necessarily reflect the official policy or position of FXStreet nor its advertisers. The author will not be held responsible for information that is found at the end of links posted on this page.
If not otherwise explicitly mentioned in the body of the article, at the time of writing, the author has no position in any stock mentioned in this article and no business relationship with any company mentioned. The author has not received compensation for writing this article, other than from FXStreet.
FXStreet and the author do not provide personalized recommendations. The author makes no representations as to the accuracy, completeness, or suitability of this information. FXStreet and the author will not be liable for any errors, omissions or any losses, injuries or damages arising from this information and its display or use. Errors and omissions excepted.
The author and FXStreet are not registered investment advisors and nothing in this article is intended to be investment advice.
Recommended content
Editors’ Picks
AUD/USD rises to two-day high ahead of Aussie CPI
The Aussie Dollar recorded back-to-back positive days against the US Dollar and climbed more than 0.59% on Tuesday, as the US April S&P PMIs were weaker than expected. That spurred speculations that the Federal Reserve could put rate cuts back on the table. The AUD/USD trades at 0.6488 as Wednesday’s Asian session begins.
EUR/USD holds above 1.0700 on weaker US Dollar, upbeat Eurozone PMI
EUR/USD holds above the 1.0700 psychological barrier during the early Asian session on Wednesday. The weaker-than-expected US PMI data for April drags the Greenback lower and creates a tailwind for the pair.
Gold price cautious despite weaker US Dollar and falling US yields
Gold retreats modestly after failing to sustain gains despite fall in US Treasury yields, weaker US Dollar. XAU/USD struggles to capitalize following release of weaker-than-expected S&P Global PMIs, fueling speculation about potential Fed rate cuts.
Ethereum ETF issuers not giving up fight, expert says as Grayscale files S3 prospectus
Ethereum exchange-traded funds theme gained steam after the landmark approval of multiple BTC ETFs in January. However, the campaign for approval of this investment alternative continues, with evidence of ongoing back and forth between prospective issuers and the US SEC.
Australia CPI Preview: Inflation set to remain above target as hopes of early interest-rate cuts fade
An Australian inflation update takes the spotlight this week ahead of critical United States macroeconomic data. The Australian Bureau of Statistics will release two different inflation gauges on Wednesday.