|

GBP/USD Price Analysis: Bears in charge as ‘shooting star’ looms

  • GBP/USD down 0.06% after reaching a three-week high of 1.2634.
  • RSI flattening suggests normalization of buying pressure.
  • Support levels at 1.2500, 1.2474, and 1.2466; breach may test 1.2400.
  • Resistance at 200-DMA, 1.2600, and DMAs at 1.2612 and 1.2644.

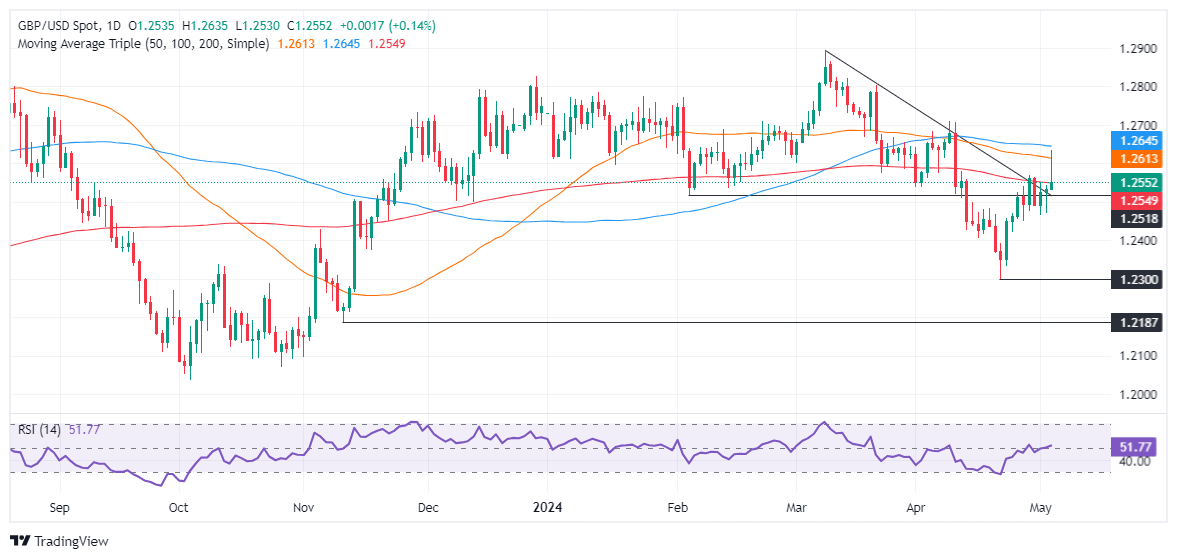
The Pound Sterling holds to gains versus the US Dollar yet retraced from three-week highs reached at 1.2634 following a softer than expected US Nonfarm Payrolls report. However, buyers lacked the strength to keep prices above 1.2600, opening the door for a test of the 200-day moving average (DMA). The GBP/USD trades at 1.2541, down by 0.06%.

GBP/USD Price Analysis: Technical outlook

The daily chart suggests the GBP/USD spike that breached the 50 and 100-DMA, reassembling a ‘shooting star’ opened the door for sellers to enter the market and dragged the spot price toward current levels. Even though the Relative Strength Index (RSI) suggests that buyers are in charge, it seems to shift flat, an indication of normalization.

Therefore, as GBP/USD bulls lose steam, that could pave the way for a deeper pullback. The first support seen is 1.2500. A drop below that level would expose the May 2 low at 1.2474, ahead of the latest pivot low at 1.2466. Once those two levels are surpassed, up next would be the 1.2400 psychological level.

Conversely, if buyers moved in, the first resistance would be the 200-DMA at 1.2548. Further upside is seen at 1.2600, followed by the 50 and 100-DMAs, each at 1.2612 and 1.2644, respectively.

GBP/USD Price Action – Daily Chart

GBP/USD

Overview
Today last price1.2546
Today Daily Change0.0012
Today Daily Change %0.10
Today daily open1.2534
 
Trends
Daily SMA201.2502
Daily SMA501.2616
Daily SMA1001.2646
Daily SMA2001.255
 
Levels
Previous Daily High1.2545
Previous Daily Low1.2472
Previous Weekly High1.2542
Previous Weekly Low1.23
Previous Monthly High1.2709
Previous Monthly Low1.23
Daily Fibonacci 38.2%1.2517
Daily Fibonacci 61.8%1.25
Daily Pivot Point S11.2489
Daily Pivot Point S21.2444
Daily Pivot Point S31.2417
Daily Pivot Point R11.2562
Daily Pivot Point R21.259
Daily Pivot Point R31.2635

Author

Christian Borjon Valencia

Christian Borjon began his career as a retail trader in 2010, mainly focused on technical analysis and strategies around it. He started as a swing trader, as he used to work in another industry unrelated to the financial markets.

More from Christian Borjon Valencia
Share:

Markets move fast. We move first.

Orange Juice Newsletter brings you expert driven insights - not headlines. Every day on your inbox.

By subscribing you agree to our Terms and conditions.

Editor's Picks

EUR/USD climbs to multi-week tops near 1.1700

EUR/USD rapidly leaves behind four consecutive daily pullbacks, challenging the 1.1700 hurdle in response to the severe sell-off in the Greenback as investors continued to evaluate the Fed’s rate cut and the neutral message from Chief Powell. Next on tap on the docket will be the weekly US labour market report on Thursday.

GBP/USD pressures intraday highs as USD gains downward traction

GBP/USD gains upward traction as the USD eased following the Federal Reserve decision to trim the benchmark interest rate by 25 bps. FOMC divided, Summary of Economic Projections shows no relevant changes.

Gold extends gains beyond $4,230 in the Fed’s aftermath

Gold prices are up after the US central bank's monetary policy announcement, trading around $4,230 as Asian traders reach their desks. A better market mood limits demand for the safe-haven metal, but broad US Dollar weakness skews the risk to the upside. 

Ethereum Price Forecast: ETH eyes $3,470 as ETF inflows show returning demand, derivatives remain muted

Traditional investors are playing a key role in Ethereum's (ETH) recent recovery after weeks on the sidelines. Ethereum exchange-traded funds (ETFs) drew in $177.6 million on Tuesday, marking a second consecutive day of positive performance and their highest inflow since October 28, according to SoSoValue data.

Fed projects only 50 bps of additional rate cuts between 2026 and 2027; lifts GDP forecasts

The Federal Open Market Committee’s (FOMC) latest dot plot, released on Wednesday, indicates that interest rates will average 3.4% by the end of 2026, in line with the September projection.

Hyperliquid eyes $30 breakout despite declining staking balance

Hyperliquid is trading above $28.00 at the time of writing on Wednesday, after rebounding from support at $27.50. The broader cryptocurrency market is characterised by widespread intraday losses ahead of the Fed monetary policy decision.