GBP/USD Price Analysis: Aims toward 1.2700 after a break of ascending channel
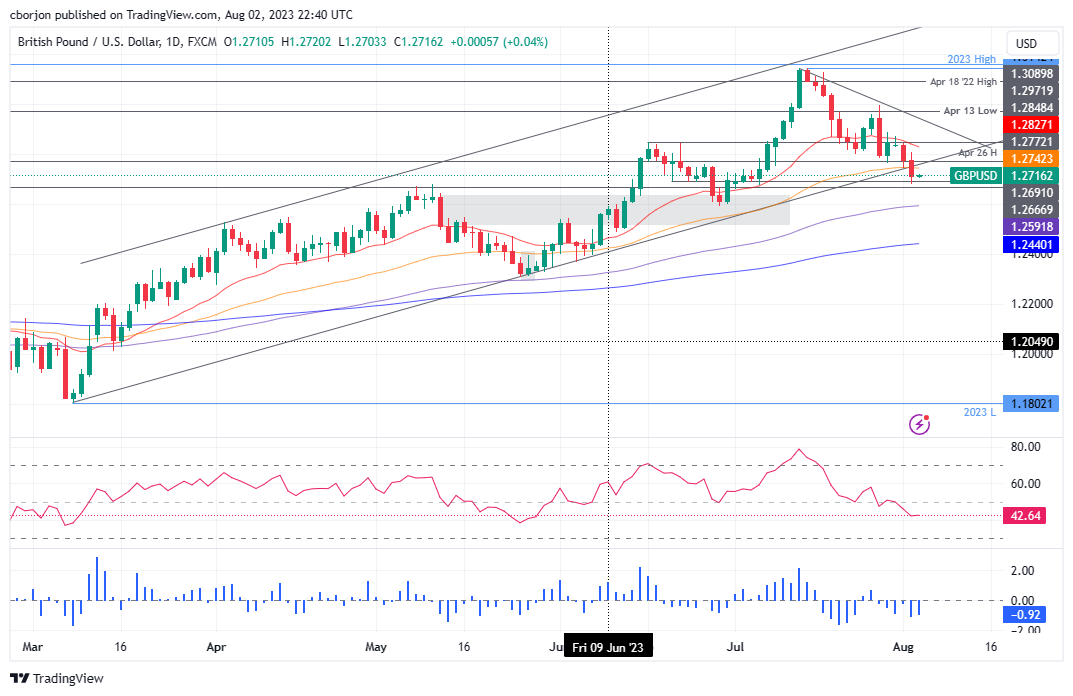
- GBP/USD breaks below the bottom of an ascending channel and the 50-day EMA at 1.2742, trading at 1.2715 with a neutral to downward bias.
- If the pair drops below the 1.2700 psychological level, support may be found at the 100-day EMA at 1.2591, followed by the 200-day EMA at 1.2440.
- A rebound above 1.2700 and reclaiming the 50-day EMA could lead to a rally towards 1.2800, with the next resistance at the 20-day EMA at 1.2827.
- The RSI has turned bearish, while the three-day RoC suggests that the 1.2700 level might hold in the short term amid the BoE monetary policy decision.

GBP/USD breaks below the bottom of an ascending channel, ahead of the Bank of Englan’s (BoE) monetary policy decision on Thursday, as the pair aims toward the 1.2700 psychological figure. As the Asian session commences, the GBP/USD is exchanging hands at 1.2715, posting minuscule gains of 0.04%.
GBP/USD Price Analysis: Technical outlook
The GBP/USD is neutral to downward biased, as the daily chart depicts, as the pair dropped on Wednesday’s session below the 50-day Exponential Moving Average (EMA) at 1.2742. In addition, the GBP/USD extended its fall below the bottom of the ascending channel, opening the door for further losses. That, alongside the Relative Strength Index (RSI) indicator turning bearish, could pave the way for a drop below 1.2700. Nevertheless, the three-day Rate of Change (RoC) portrays a slight divergence with price action, suggesting that the 1.2700 psychological level might hold in the near term.
If GBP/USD drops below 1.2700, next support emerges at the 100-day EMA at 1.2591, followed by the 200-day EMA at 1.2440. Conversely, if GBP/USD stays above 1.2700 and reclaims the 50-day EMA at 1.2742, that could exacerbate a rally towards 1.2800 and beyond. Next resistance emerges at the 20-day EMA at 1.2827, followed by a downslope resistance trendline at 1.2925/40.
GBP/USD Price Action – Daily chart
Author

Christian Borjon Valencia
FXStreet
Markets analyst, news editor, and trading instructor with over 14 years of experience across FX, commodities, US equity indices, and global macro markets.