|

GBP/USD Price Analysis: 1.3570 is the next relevant target for bears

  • GBP/USD continued losing ground on Friday and dropped to one-month lows in the last hour.
  • Sustained USD buying, disappointing UK macro data bot contributed to the ongoing downfall.
  • Weakness below July swing lows will set the stage for an extension of the depreciating move.

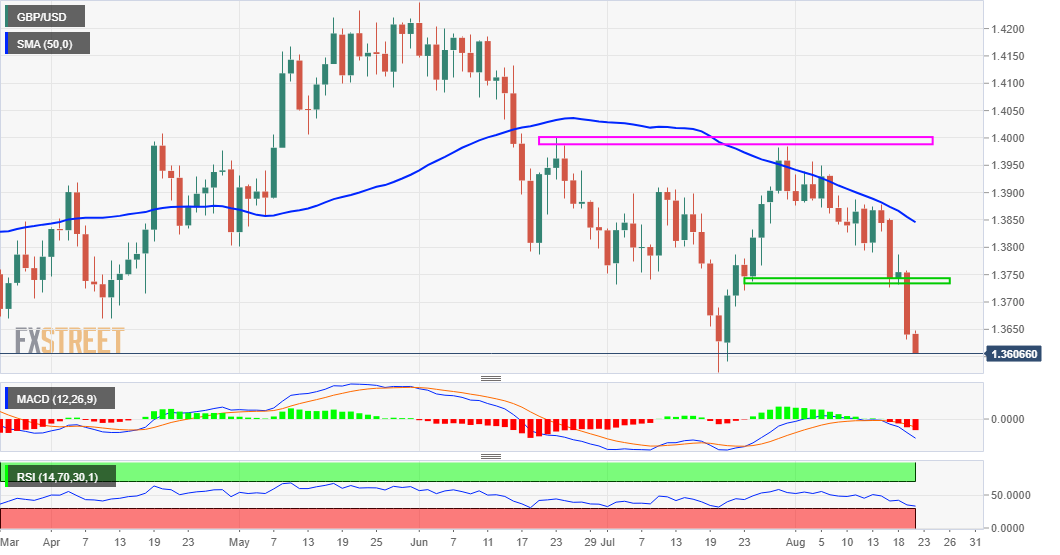
The GBP/USD pair added to the previous day's heavy losses and witnessed some follow-through selling on the last day of the week. This marked the fourth day of a negative move in the previous five and dragged the pair to the 1.3600 neighbourhood, or one-month lows during the mid-European session.

The prevalent risk-off environment, along with expectations that the Fed will begin rolling back its pandemic-era stimulus pushed the safe-haven US dollar to a nine-and-half-month high on Friday. Apart from this, the disappointing release of the UK monthly Retail Sales figures weighed on the British pound and contributed to the GBP/USD pair's ongoing decline.

From a technical perspective, the overnight slide confirmed a double-top breakdown through the neckline support near the 1.3725 region. Subsequent weakness below the 1.3700 mark validated the bearish set-up and contributed to the ongoing decline. However, oversold RSI on hourly charts held traders from placing fresh bearish bets, at least for the time being.

Nevertheless, the bias remains tilted firmly in favour of bearish traders and supports prospects for a fall back towards retesting July monthly swing lows, around the 1.3570 region. This is followed by support near mid-1.3500s, below which the downward trajectory could further get extended and drag the GBP/USD pair towards challenging the key 1.3500 psychological mark.

On the flip side, any attempted recovery back above the 1.3640-50 region might now confront stiff resistance ahead of the 1.3700 mark. A sustained strength beyond might prompt some short-covering move towards the 1.3680-90 zone. The momentum might still be seen as a selling opportunity and runs the risk of fizzling out quickly, rather remain capped near the 1.3725 support breakpoint.

GBP/USD daily chart

fxsoriginal

Technical levels to watch

GBP/USD

Overview
Today last price1.3607
Today Daily Change-0.0033
Today Daily Change %-0.24
Today daily open1.364
 
Trends
Daily SMA201.3845
Daily SMA501.3856
Daily SMA1001.3926
Daily SMA2001.3789
 
Levels
Previous Daily High1.3758
Previous Daily Low1.3632
Previous Weekly High1.3894
Previous Weekly Low1.3791
Previous Monthly High1.3984
Previous Monthly Low1.3572
Daily Fibonacci 38.2%1.368
Daily Fibonacci 61.8%1.371
Daily Pivot Point S11.3596
Daily Pivot Point S21.3551
Daily Pivot Point S31.347
Daily Pivot Point R11.3722
Daily Pivot Point R21.3803
Daily Pivot Point R31.3848

Author

Haresh Menghani

Haresh Menghani is a detail-oriented professional with 10+ years of extensive experience in analysing the global financial markets.

More from Haresh Menghani
Share:

Editor's Picks

AUD/USD falls to near 0.7100 after slipping below 50-day EMA

AUD/USD depreciates after registering minor gains in the previous day, trading around 0.7120 during the Asian hours. The technical analysis of the daily chart shows the pair consolidating sideways within a rectangle pattern, as neither bulls nor bears gain control. The AUD/USD pair is holding a slight bearish tone however as it sits beneath both the nine-day and 50-day EMAs.

160.00: USD/JPY back near intervention territory after upbeat US jobs report

US Nonfarm Payrolls beat expectations by a wide margin in May, with 172K jobs added. The US Dollar rebounds after the release, helping USD/JPY recover from its intraday lows. Warnings from Japanese authorities continue to limit upside potential near the 160.00 threshold.

Gold targets $4,300 amid stronger Dollar

Gold faces increasing selling interest and navigates the area of three-month lows near the $4,300 mark per troy ounce on Friday. The precious metal’s decline comes as traders assess the stronger-than-expected NFP, while the bid bias in the Greenback and higher US Treasury yields also collaborate with the retracement.

Cardano hits five-year low even as Hoskinson clarifies "break" isn't an exit

Cardano (ADA) price is down 10% at press time on Friday, extending losses over 30% so far this week amid Charles Hoskinson's clarification that "break" isn't an exit.

Week ahead – Fed countdown begins amid US inflation data and geopolitical risks

Fed Chair Warsh’s first meeting approaches as key US inflation data could reshape expectations. Oil prices remain elevated as US-Iran talks continue; tariffs also return to the spotlight. ECB is expected to hike; will it be a one-off move or is July live?

The US economy defies the rules: 100 days into the Oil shock and the recession signal is still missing

More than three months after the start of the Iran war and the resulting disruption to global energy markets, the US economy continues to display remarkable resilience. The conflict has triggered a sharp rise in Oil prices, reignited inflationary pressures and fueled widespread concerns about a potential economic slowdown.