|

GBP/USD post losses amidst risk aversion, China’s economic woes

  • GBP/USD faces a 0.12% loss, influenced by high US Treasury bond yields and global trade apprehensions.
  • US Existing Home Sales dropped 2.2% in July; limited inventory and high mortgage rates cited as causes.
  • Richmond Fed’s Manufacturing Index meets expectations with -7, while the Services Index surprises with a positive 4.

GBP/USD retreated after testing the 50-day Moving Average (DMA) but dropped mainly on high US Treasury bond yields and risk aversion spurred by the recent developments surrounding China. Fears that the country with the second largest economy in the world can sharply slow down could weigh on global trade. Hence, the GBP/USD is trading at 1.2741, registering losses of 0.12% at the time of writing.

US stocks decline, Greenback strengthens: global trade tensions rise with China’s economic uncertainties.

US stocks are experiencing a decline due to the prevailing fragile market sentiment. The National Association of Realtors (NAR) released data indicating a 2.2% decrease in Existing Home Sales for July. This, however, represents an improvement compared to the preceding month’s figure of -3.3%. NAR Chief Economist Lawrence Yun attributed this decline to factors such as limited “inventory availability” and elevated “mortgage rates,” according to the report.

Other data revealed by the Richmond Fed, the Manufacturing Index plummeted -7 as expected in August, though its Services Index exceeded estimates of a -4 contraction, came at 4.

US bond yields are mixed as the short-end of the curve continues to bull-steepen, while the 10s, 20s, and 30s drop between 0.18 and 0.47 percent. However, the Greenback (USD) continues to rise, with the US Dollar Index (DXY) measuring the buck’s value vs. six currencies, advancing 0.26%, at 103.588.

In recent statements by Richmond Fed President Thomas Barkin, he emphasized that the yield shift does not indicate “inappropriate” market tightening. Instead, he views it as a reaction to robust economic data. Barkin further stated that if inflation maintains its elevated levels and the economy continues showing signs of strength, it would bolster the argument for additional tightening measures.

On the US front, the economic docket would feature Fed speakers, S&P Global PMIs, Durable Good Orders, and New Home Sales.

In the meantime, the UK economic docket would feature the release of S&P Global/CIPS PMIs, which are expected to continue to weaken; in services and manufacturing. The Manufacturing PMI is expected to slide for six consecutive months, while the services PMI is expected to climb to 51.3.

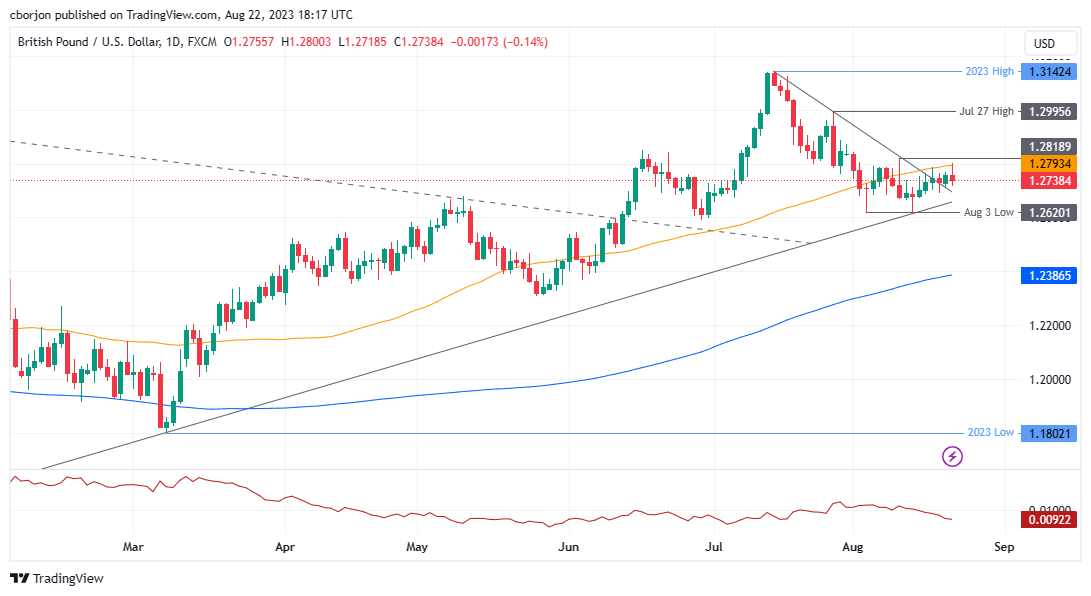
GBP/USD Price Analysis: Technical outlook

The GBP/USD remains neutrally biased but trading within the 50-day Moving Average (DMA) and the 1.2600 figure for the latest month-to-date (MTD). A bullish resumption would happen once buyers reclaim the 1.2800 mark, exacerbating a rally towards 1.3000, with 1.2900 seen as initial resistance. Conversely, if GBP/USD drops below 1.2600, that could expose the GBP/USD pair to selling pressure. Key support levels to test would be 1.2500, followed by the 200-DMA at 1.2387.

GBP/USD Price Action - Daily chart

GBP/USD

Overview
Today last price1.274
Today Daily Change-0.0016
Today Daily Change %-0.13
Today daily open1.2756
 
Trends
Daily SMA201.2763
Daily SMA501.2793
Daily SMA1001.2632
Daily SMA2001.2384
 
Levels
Previous Daily High1.2767
Previous Daily Low1.271
Previous Weekly High1.2788
Previous Weekly Low1.2617
Previous Monthly High1.3142
Previous Monthly Low1.2659
Daily Fibonacci 38.2%1.2745
Daily Fibonacci 61.8%1.2732
Daily Pivot Point S11.2722
Daily Pivot Point S21.2688
Daily Pivot Point S31.2666
Daily Pivot Point R11.2778
Daily Pivot Point R21.2801
Daily Pivot Point R31.2835

Author

Christian Borjon Valencia

Markets analyst, news editor, and trading instructor with over 14 years of experience across FX, commodities, US equity indices, and global macro markets.

More from Christian Borjon Valencia
Share:

Editor's Picks

AUD/USD consolidates above 0.7000/two-month low; bearish potential intact

The AUD/USD pair oscillates in a narrow range during the Asian session, and moves little following the release of mixed inflation figures from China. Spot prices currently trade around the 0.7025 region, nearly unchanged for the day, and remain within striking distance of a nearly two-month low set on Tuesday. Renewed hostilities between the US and Iran temper hopes for a deal to end the over three-month-old war.

Japanese Yen languishes despite wholesale inflation accelerates in May

USD/JPY flatlines after experiencing volatility, trading around 160.40 during the Asian hours on Wednesday. The pair continues to hold its ground, reflecting a struggling Japanese Yen that has failed to find support despite a massive acceleration in wholesale inflation. Driven by surging energy costs linked to the ongoing Middle East conflict, Japan’s Producer Price Index jumped 6.3% year-over-year in May. This hot printing comfortably outpaced April’s upwardly revised 5.3% figure and surpassed market consensus of 5.5%, marking the fastest pace of wholesale price growth in three years.

$4,200: Gold retains bearish bias near March low ahead of US CPI

Gold recovers slightly after touching a fresh low since March 23, though it retains a bearish bias near the $4,200 mark through the early European session. Renewed hostilities between the US and Iran fuel inflationary concerns and bolster bets for more hawkish central banks, which is seen as a key factor driving flows away from the non-yielding yellow metal. Furthermore, the decline could be attributed to technical selling following the recent breakdown below the very important 200-day SMA.

Cardano's downtrend deepens despite on-chain bottoming signals

Cardano edges lower to $0.1600 signaling a potential extension of the 30% loss from last week. The altcoin remains under intense selling pressure, weighing on its retail support. Still, a spike in dormant supply re-entering circulation signals that the selling pressure has run its course, a pattern that often precedes a rebound.

US CPI data set to show inflation at three-year high in May, backing Fed hawkish tilt

The US Bureau of Labor Statistics will publish the May Consumer Price Index (CPI) data on Wednesday. The report is expected to show another step up in consumer inflation, driven by the persistently high Oil prices due to the ongoing crisis in the Middle East.

The US economy defies the rules: 100 days into the Oil shock and the recession signal is still missing

More than three months after the start of the Iran war and the resulting disruption to global energy markets, the US economy continues to display remarkable resilience. The conflict has triggered a sharp rise in Oil prices, reignited inflationary pressures and fueled widespread concerns about a potential economic slowdown.