GBP/USD plunges but stays afloat above 1.2900 amid cooling inflation in the UK
- UK’s June CPI came in at 7.9% YoY, lower than the expected 8.2% and May’s 8.7%, hinting at easing price pressures.
- Expectations for a 50 bps rate hike by the BoE dropped to 45%, leading to a GBP/USD drop of more than 110 pips.
- US Department of Commerce data showed a MoM decrease of -8.0% in Housing Starts and -3.7% in Building Permits.
- Speculations suggest the US Federal Reserve may halt rate hikes after a predicted 25 bps hike in July, with the first cut expected in March 2024.

GBP/USD plunged after the release of inflation figures in the United Kingdom (UK), extending its losses during the North American session, briefly touching the 20-day EMA below the 1.2900 figure. Still, soft US economic data triggered a recovery above the latter. The GBP/USD trades at 1.2914, losses 0.93%.
UK inflation figures trigger a drop in GBP/USD, with losses extending to touch the 20-day EMA before a slight recovery spurred by weak US data
Key economic data revealed in the UK provided some relief for the Bank of England (BoE), which has been under a lot of pressure as it has failed to deliver price stability to British households. June’s inflation figures revealed that price pressures are easing, following the path dictated by the US economy. The Consumer Price Index (CPI) came in at 7.9% YoY, vs. 8.2% expected, well below May’s 8.7%, while core CPI rose by 7.3% YoY, below 7.9% in May.
Following the data, expectations for a 50 bps tightening by the BoE subsided, falling to 45%, after being priced in since Monday. The swaps market estimated 25 bps hikes in September, and November, with Bank Rates expected to peak at 5.75%-6.00%. Consequently, rates repricing in the UK sent the GBP/USD plummeting close to 1% or more than 110 pips.
Across the pond, not so meaning data in the United States (US) showed the housing market, although it’s recovering, slowed its pace, according to the latest data from the US Department of Commerce. Housing Starts experienced a -8.0% MoM decline, after an outstanding increase, in May of 21.7%, which marked the highest growth rate in 11 months. The number of housing starts decreased from 1.631 million to 1.434 million. Furthermore, Building Permits also dropped by -3.7% compared to the previous month, in contrast to May’s growth of 5.6%. The number of permits issued decreased from 1.496 million to 1.440 million.
In the meantime, speculators seem convinced that the US Federal Reserve (Fed) is almost done raising rates, as the CME FedWatch Tool shows odds for July’s 25 bps hike at 99%, but no more increases are expected. The first Fed cut is awaited in March 2024.
The GBP/USD might continue to trade with an upward bias, despite today’s weakness. With interest rates set in the UK to remain higher than in the US, further Pound Sterling (GBP) strength is expected if recessionary woes around the UK economy fade. If the UK falls into a recession, the greenback’s safe-haven status could weigh on the GBP/USD pair.
GBP/USD Price Analysis: Technical outlook
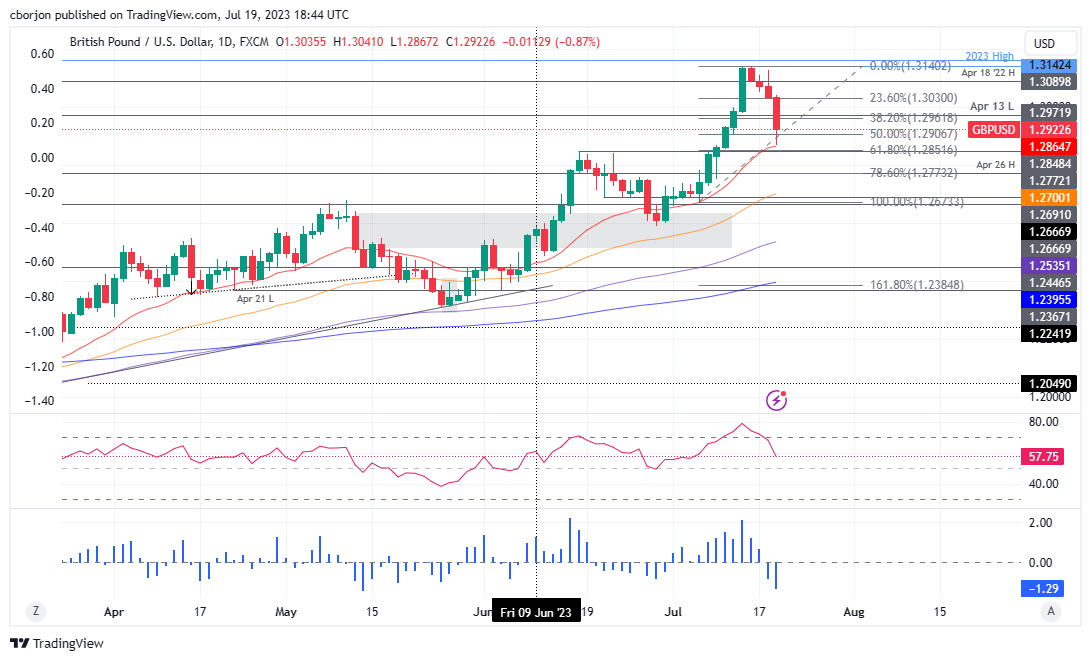
As written in a GBP/USD news article on July 17, I wrote that “The GBP/USD daily chart portrays the pair as upward biased but on an ongoing correction after hitting a year-to-date (YTD) high of 1.3142,” also added that once 1.2962 was breached, it “will expose the 50% Fibo retracement at 1.2906, followed by the confluence of the June 16 high and the 61.8% Fibo at around 1.2848/51.” Even though the scenario did not unfold exactly like that, the GBP/USD dipped to 1.2867 before the pair resumed upwards. Nevertheless, the GBP/USD bias has shifted less bullish in the short term unless buyers reclaim 1.3000. Otherwise, a GBP/USD extension below 1.2850 would expose the confluence of the 50-day EMA and the .2700 figure.
Author

Christian Borjon Valencia
FXStreet
Markets analyst, news editor, and trading instructor with over 14 years of experience across FX, commodities, US equity indices, and global macro markets.


