|

GBP/USD New York Price Forecast: Pound under heavy pressure in five-month lows, fast approaching 1.2200 figure

  • GBP/USD is dropping sharply, now nearing the 1.2200 figure.
  • The level to beat for bears is the 1.2230 support.
 

GBP/USD daily chart

 
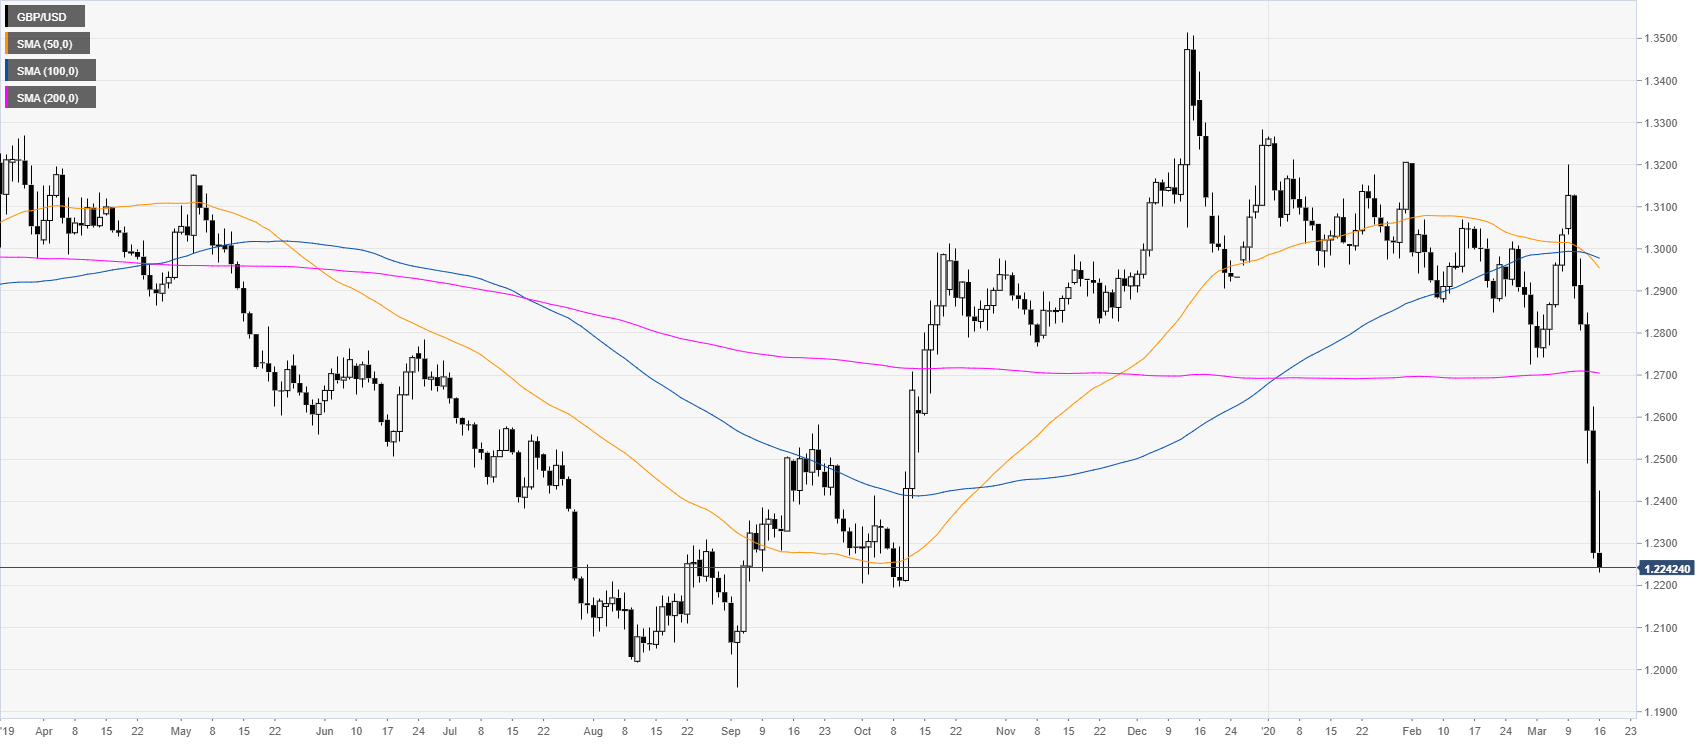
GBP/USD is dropping like a stone in March 2020 as the market is nearing its lowest point since October 2019. Despite the overnight Fed cut, GBP/USD remains extremely weak.
 

GBP/USD four-hour chart

 
GBP/USD is under heavy selling pressure in five-month lows trading well bealow its main SMAs. The bears are in control and a break below the 1.2230 support can lead to further losses towards the 1.2160 and 1.2000 figures, according to the Technical Confluences Indicator.
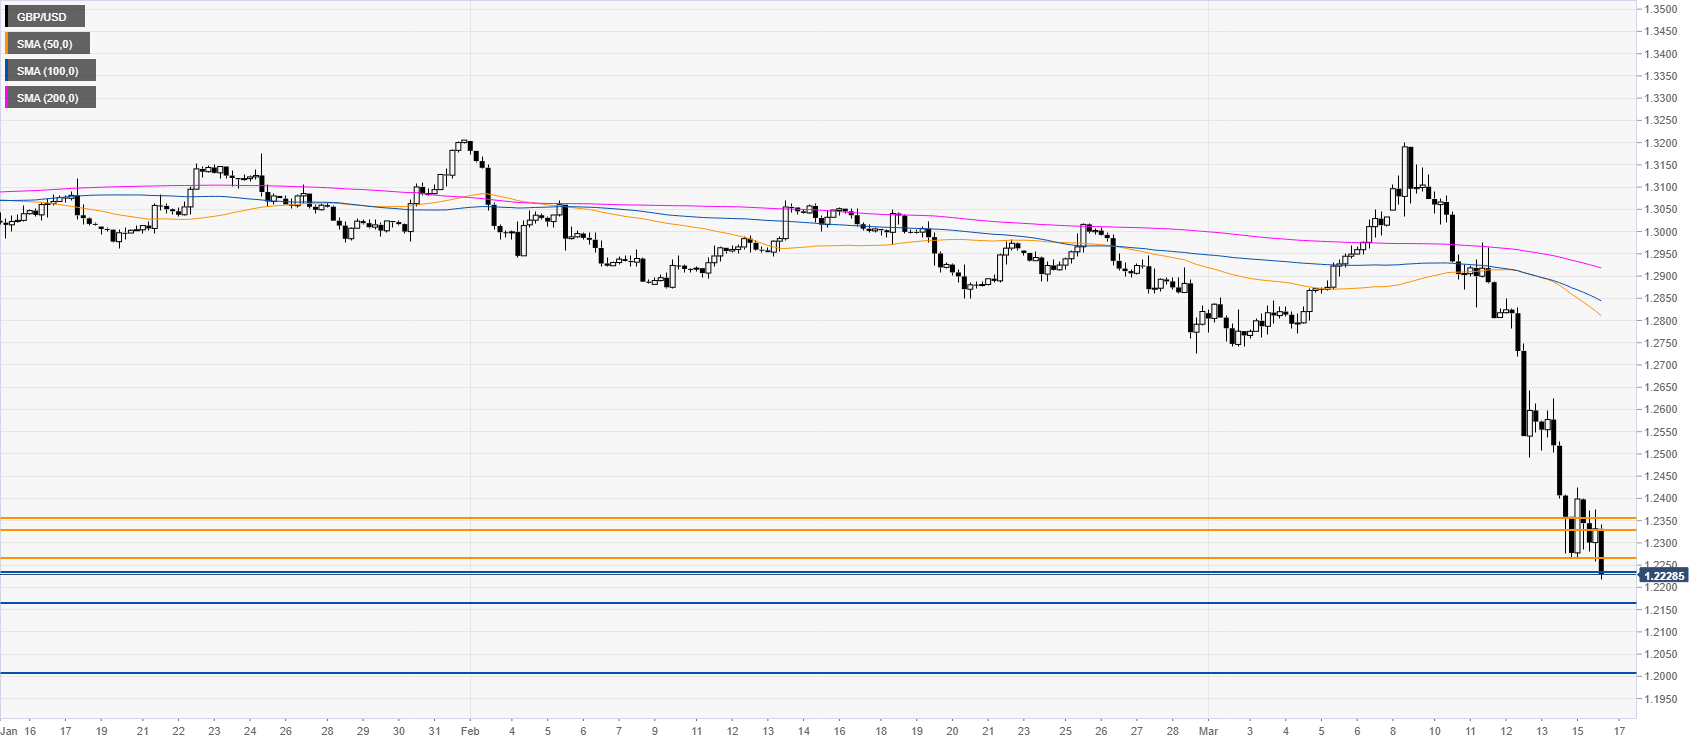
 
Resistance: 1.2263, 1.2326, 1.2352
Support: 1.2230, 1.2160, 1.2000


Additional key levels

GBP/USD

Overview
Today last price1.2231
Today Daily Change-0.0046
Today Daily Change %-0.37
Today daily open1.2277
 
Trends
Daily SMA201.2873
Daily SMA501.2972
Daily SMA1001.2985
Daily SMA2001.2708
 
Levels
Previous Daily High1.2625
Previous Daily Low1.2264
Previous Weekly High1.3201
Previous Weekly Low1.2264
Previous Monthly High1.3204
Previous Monthly Low1.2726
Daily Fibonacci 38.2%1.2402
Daily Fibonacci 61.8%1.2487
Daily Pivot Point S11.2153
Daily Pivot Point S21.2028
Daily Pivot Point S31.1792
Daily Pivot Point R11.2513
Daily Pivot Point R21.2749
Daily Pivot Point R31.2874

Author

Flavio Tosti

Flavio Tosti

Independent Analyst


More from Flavio Tosti

Share:

Editor's Picks

GBP/USD: Daily gains remain capped by 1.3650

GBP/USD leaves behind Monday’s pessimism and advances marginally on Tuesday. Cable’s humble gains, however, appear to have met quite a decent resistance in the 1.3650 zone for now, in a context of a slight selling pressure hovering around the Greenback.

EUR/USD picks some pace, retests 1.1670

EUR/USD advances modestly and revisits the 1.670 zone on turnaround Tuesday. The pair’s slight advance comes after two daily drops in a row and follows the humble decline in the US Dollar, while investors gear up for upcoming US data and the Jackson Hole Symposium.

Gold treads water around $4,650

Gold navigates the middle of its daily range near $4,650 per troy ounce on Tuesday. The lack of clear direction in the yellow metal comes on the back of the widespread cautious tone among market participants, a mildly offered stance in the US Dollar and a marked decline in US Treasury yields across the curve.

Crypto Today: Bitcoin soars past $80K as Ethereum and XRP hold gains

Bitcoin (BTC) is trading above $80,000 on Tuesday. This is the highest level the Crypto King has traded since mid-May, underscoring a positive shift in investors' risk-on sentiment, liquidity conditions and the technical outlook.

Nvidia earnings: A quick look at expectations

The 2026 Q2 earnings season is nearly over for S&P 500 members, with the reporting cycle notably positive. But looming large this week is none other than AI-favorite NVIDIA (NVDA) , whose results will wrap up the reporting cycle for the Magnificent Seven group as well.

$20 billion offered, $2 billion taken: Why Treasury doubled its buyback cap

The US Treasury moved off its own calendar on Wednesday, and that is the part worth sitting with. At 12:32 GMT, the department said it would at least double the size of liquidity support buyback operations in the 10-year to 20-year and 20-year to 30-year sectors, lifting the maximum from $2 billion per operation to at least $4 billion, effective September 9 and running to November 4.
















