GBP/USD grapples with 1.2700 handle as markets bid into a hefty trading week
- BRC Like-For-Like Retail Sales the biggest-hitting UK data this week.
- US NFP looms ahead on Friday, ADP employment preview on Wednesday.
- Fed rate cut hopes are on the rise once again, but Fed Chair Powell remains a threat.

GBP/USD climbed into the 1.2700 handle on Monday before falling back, paring away some of the day’s gains but hitting the rollover higher than it started.
The UK sees only a thin showing on the economic calendar this week, and another US Nonfarm Payrolls (NFP) labor print on Friday sees investors gearing up for another kick at the can on how soon the Federal Reserve (Fed) will begin cutting interest rates.
Tuesday’s UK BRC Like-For-Like Retail Sales for the year ended February are expected to print at 1.6% YoY versus the 1.4% previous. On the US side for Tuesday, the ISM Services Purchasing Managers Index (PMI) for February is forecast to tick lower to 53.0 from the previous month’s 53.4.
US labor figures feature heavily this week, with ADP Employment Change on Wednesday followed by Friday’s NFP report. ADP Employment Change is forecast to jump to 150K for February versus the previous 107K, while this Friday’s NFP is currently forecast to fall back to 200K from the previous 353K.
Fed Chairman Jerome Powell will also be making an appearance this week, testifying before the US Congress’ House Financial Services Committee regarding the Fed’s Semi-Annual Monetary Policy Report. Plenty of soundbites and headlines are expected over the two day central bank showing, beginning on Wednesday and wrapping up Thursday.
GBP/USD technical outlook
GBP/USD found a hard technical barrier at the 1.2700 handle on Monday, but the pair managed to eke out a thin gain on the day, gaining around a quarter of a percent by the closing bell.
The pair continues to find technical support from the 200-day Simple Moving Average (SMA) at 1.2578, but near-term technical resistance at 1.2700 is capping off bullish momentum and preventing a topside recovery into last December’s peak bids near 1.2800.
GBP/USD hourly chart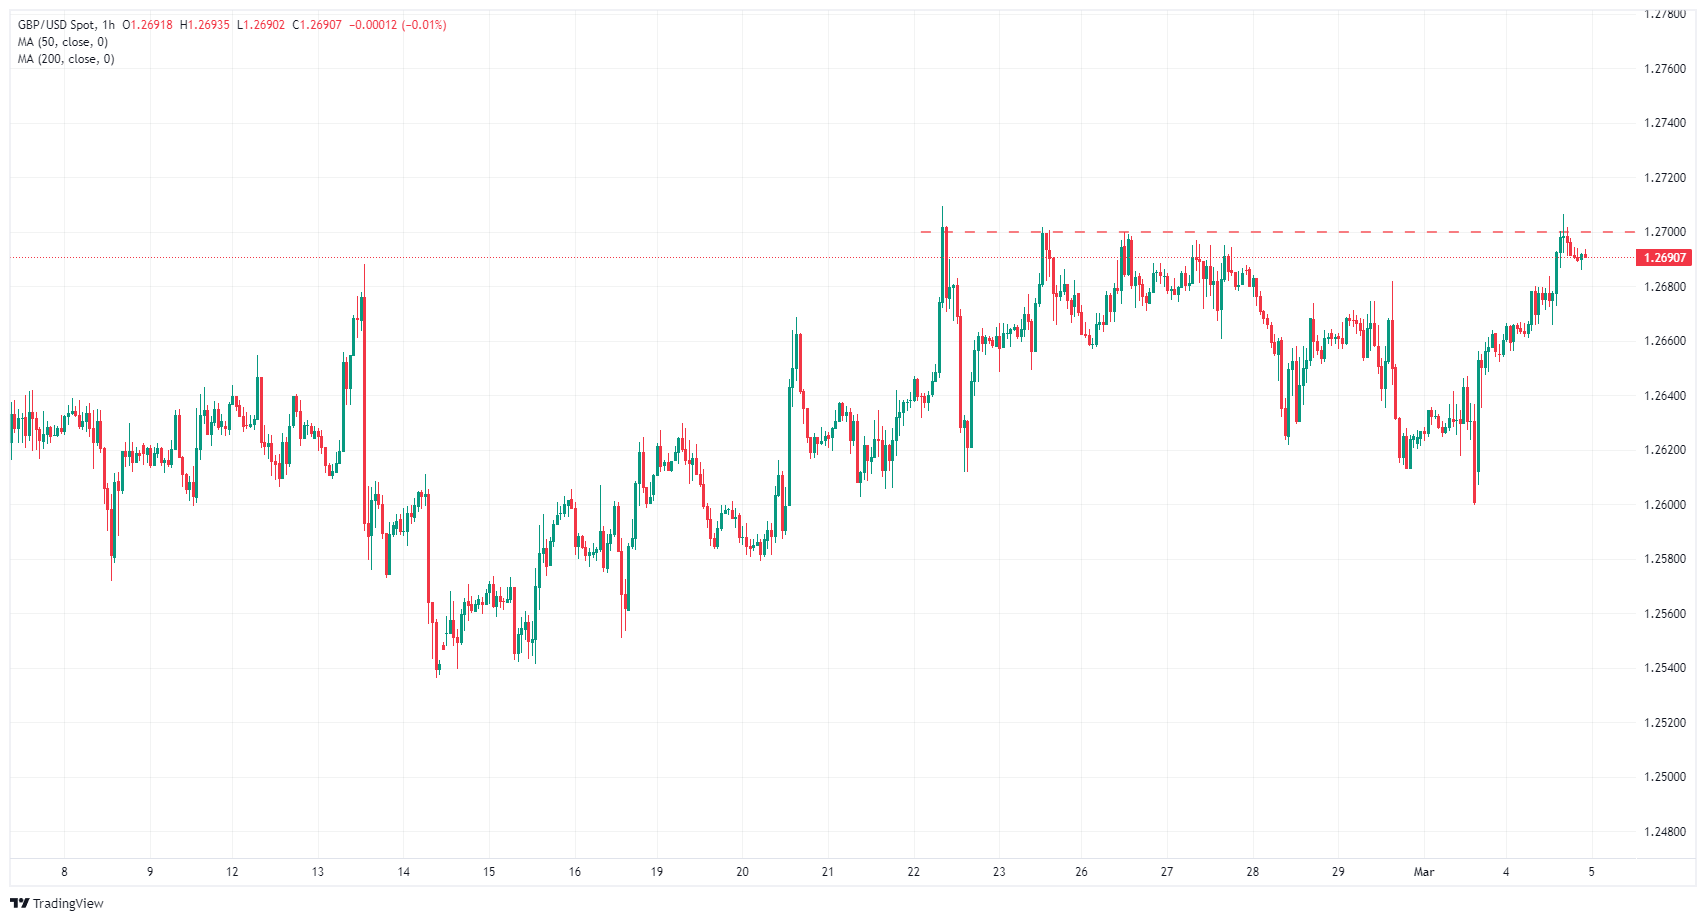
GBP/USD daily chart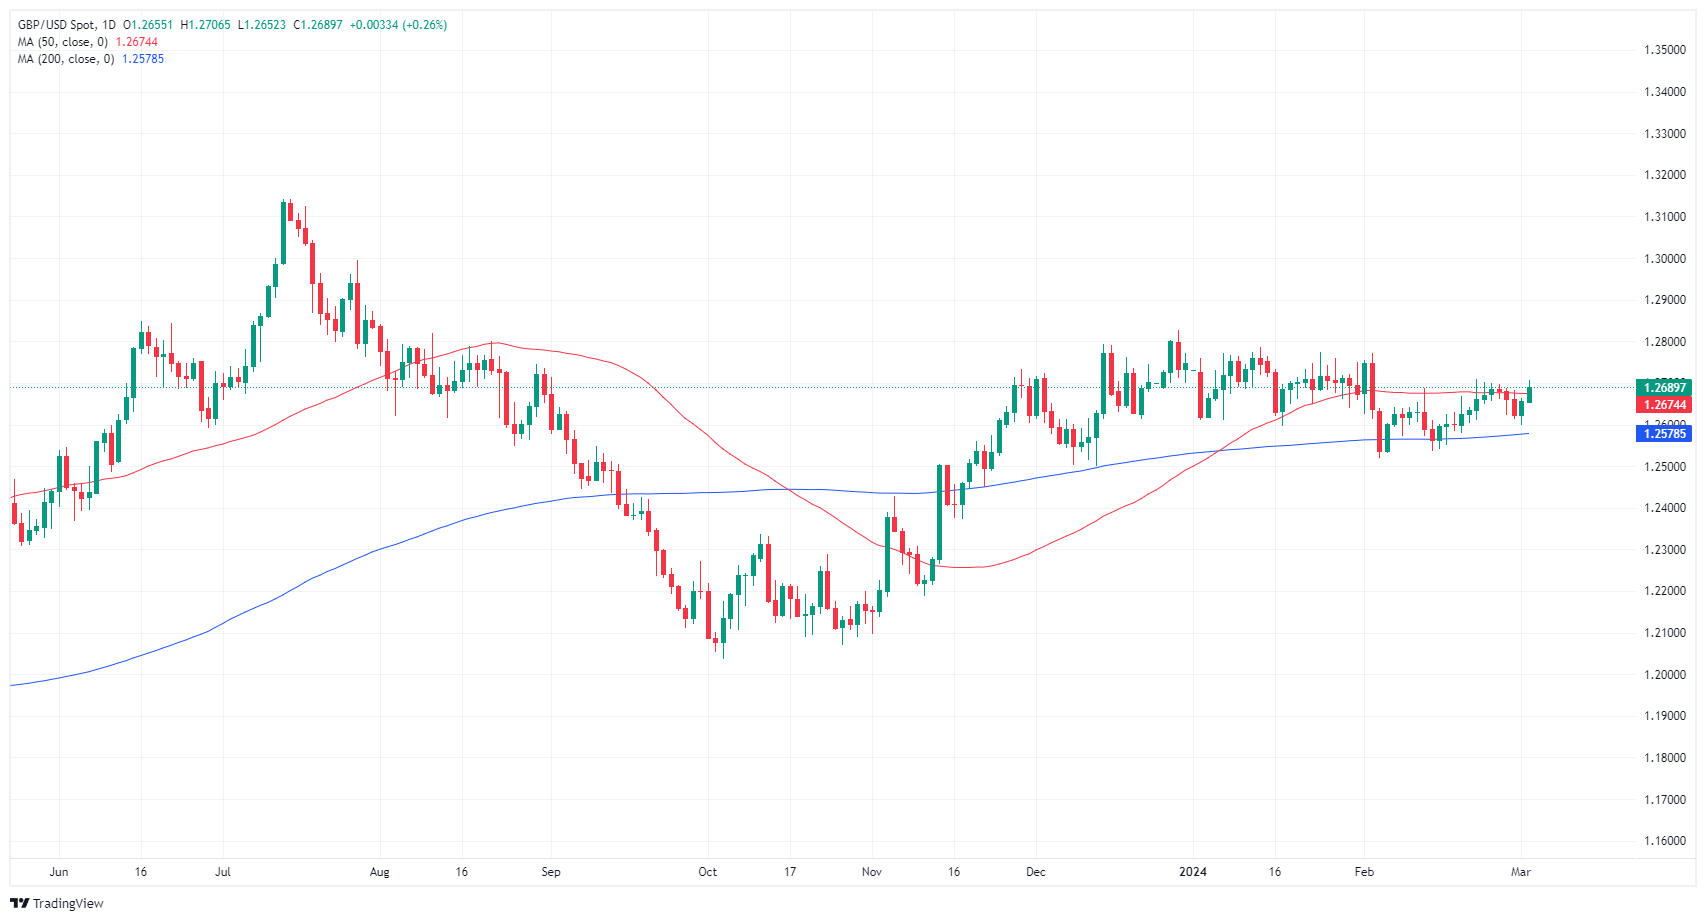
Author

Joshua Gibson
FXStreet
Joshua joins the FXStreet team as an Economics and Finance double major from Vancouver Island University with twelve years' experience as an independent trader focusing on technical analysis.


