GBP/USD flat near 1.3450 as softer US CPI revives Fed cut bets
- GBP/USD edges lower after US CPI shows easing core inflation, reinforcing Fed cut expectations for 2026.
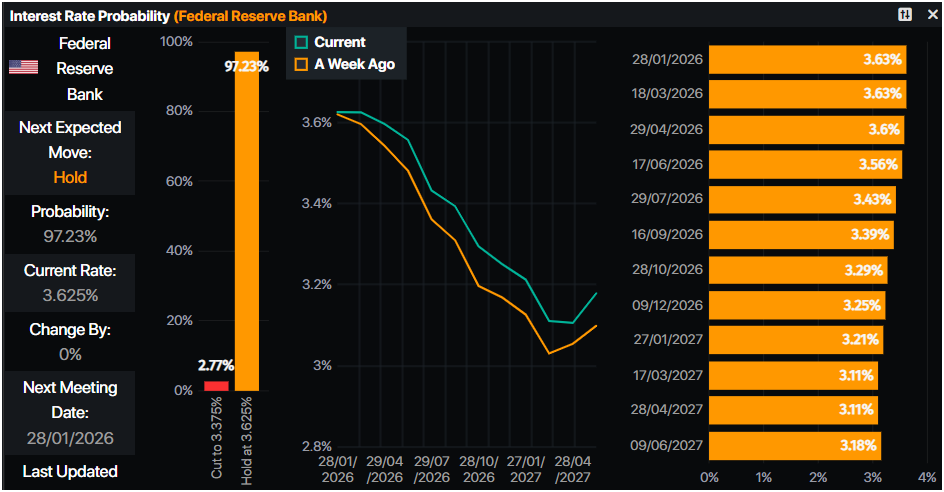
- Markets rule out a January Fed cut despite softer data amid political tensions surrounding Fed leadership.
- Traders await UK GDP and US PPI, Retail Sales for fresh directional signals.

The British Pound (GBP) turns negative on Tuesday, yet it remains near its opening price after the latest US inflation report opens the door for the Federal Reserve to continue easing policy in 2026. At the time of writing, GBP/USD trades at 1.3450, down 0.03%.
Sterling holds steady as US inflation cools, expectations for further Fed easing increase
The US Consumer Price Index (CPI) in December increased 0.3% MoM, but in the twelve months through December, the CPI rose 2.7% unchanged from November’s print. Core CPI for the same period was unchanged at 0.2% MoM, and on an annual basis was below estimates of 2.7%, at 2.6%.
Although the data was positive, market participants do not expect a Fed rate cut in the January meeting, following the clash between the Fed Chair Jerome Powell and the Trump administration.
Money markets have priced in nearly 50 basis points of interest rate cuts by the Fed towards the end of 2026, according to Prime Market Terminal.
Meanwhile, St. Louis Fed President Alberto Musalem is crossing the wires. He said the economy is expected to grow at or above potential, reiterating that inflation is closer to 3% than 2%, but would ebb this year. Musalem added that policy is in a good place and supported a December cut “because saw slightly higher risk to labor market.”
Regarding the UK, the economic docket is absent with traders waiting for the release of Gross Domestic Product (GDP) figures on Thursday. The GDP is projected to remain unchanged at 0% in November, which would be an improvement compared to October’s 0.1% contraction.
In the US, Wednesday’s schedule will feature the Producer Price Index (PPI) for October and November, along with Retail Sales data for November.
GBP/USD Price Forecast: Technical outlook
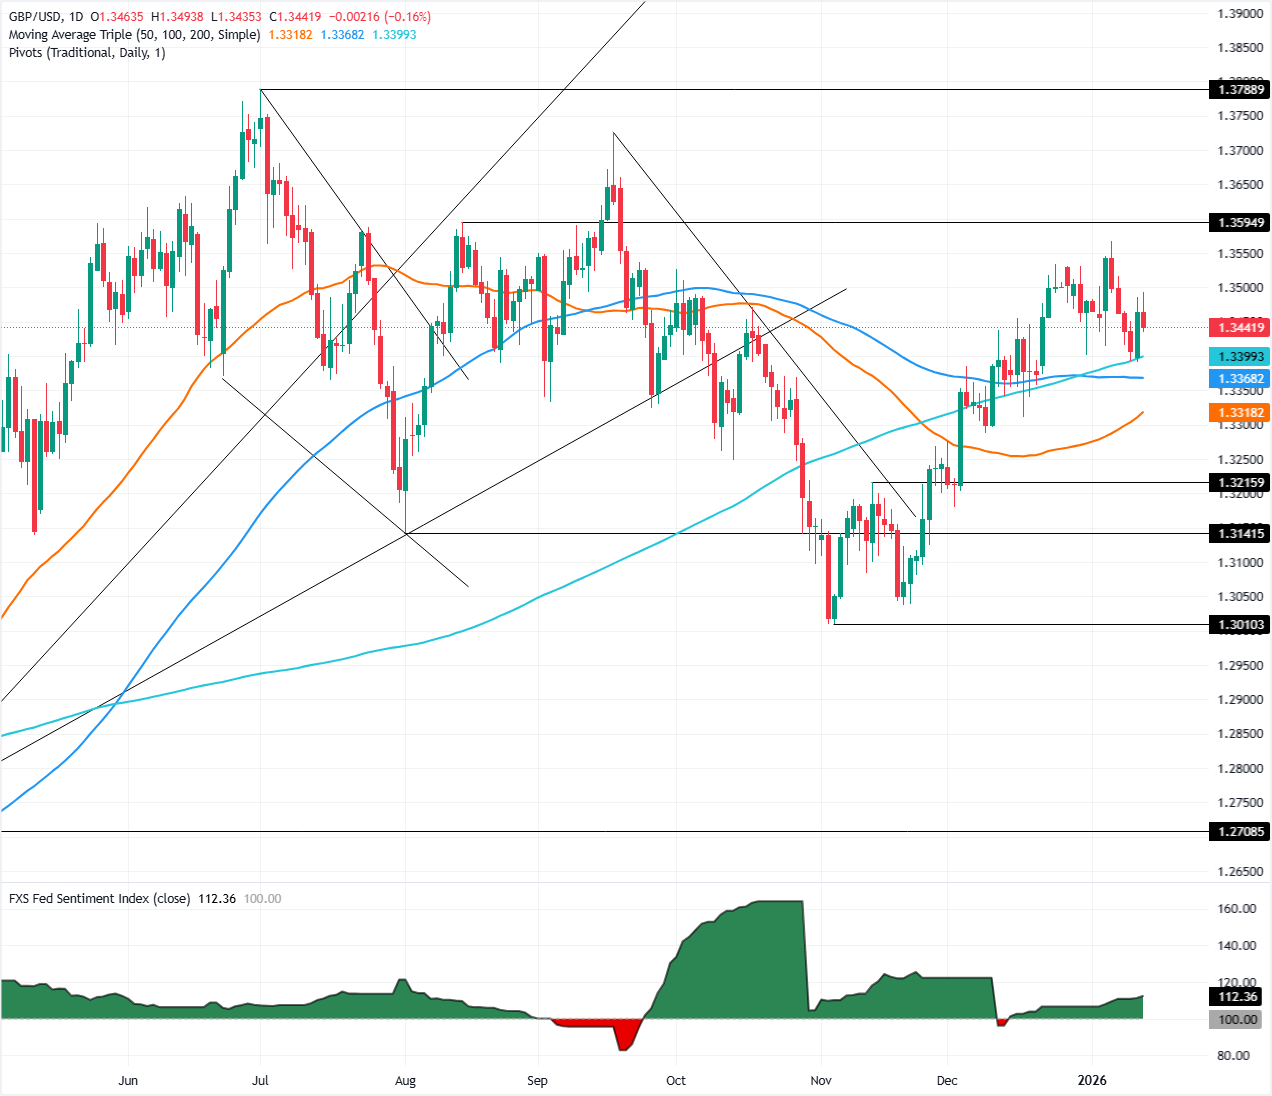
The GBP/USD daily chart shows the pair is consolidating at around the 1.3390-1.3498 area, capped on the upside by the 1.3500 figure, and by the 200-day Simple Moving Average (SMA) at 1.3388.
For a bullish continuation, traders must clear 1.3500 to challenge the next cycle high at 1.3567, the yearly peak. Up next lies 1.3700. Conversely, if bears push prices below 1.3400, expect a test of the 200-day SMA, with further downside seen at the 100-day SMA at 1.3369.
Pound Sterling Price This week
The table below shows the percentage change of British Pound (GBP) against listed major currencies this week. British Pound was the strongest against the Japanese Yen.
| USD | EUR | GBP | JPY | CAD | AUD | NZD | CHF | |
|---|---|---|---|---|---|---|---|---|
| USD | -0.15% | -0.32% | 0.56% | -0.22% | -0.01% | -0.25% | -0.11% | |
| EUR | 0.15% | -0.18% | 0.78% | -0.04% | 0.14% | -0.10% | 0.04% | |
| GBP | 0.32% | 0.18% | 0.94% | 0.12% | 0.32% | 0.08% | 0.23% | |
| JPY | -0.56% | -0.78% | -0.94% | -0.80% | -0.60% | -0.83% | -0.69% | |
| CAD | 0.22% | 0.04% | -0.12% | 0.80% | 0.19% | -0.03% | 0.11% | |
| AUD | 0.01% | -0.14% | -0.32% | 0.60% | -0.19% | -0.23% | -0.10% | |
| NZD | 0.25% | 0.10% | -0.08% | 0.83% | 0.03% | 0.23% | 0.13% | |
| CHF | 0.11% | -0.04% | -0.23% | 0.69% | -0.11% | 0.10% | -0.13% |
The heat map shows percentage changes of major currencies against each other. The base currency is picked from the left column, while the quote currency is picked from the top row. For example, if you pick the British Pound from the left column and move along the horizontal line to the US Dollar, the percentage change displayed in the box will represent GBP (base)/USD (quote).
Economic Indicator
Consumer Price Index (YoY)
Inflationary or deflationary tendencies are measured by periodically summing the prices of a basket of representative goods and services and presenting the data as The Consumer Price Index (CPI). CPI data is compiled on a monthly basis and released by the US Department of Labor Statistics. The YoY reading compares the prices of goods in the reference month to the same month a year earlier.The CPI is a key indicator to measure inflation and changes in purchasing trends. Generally speaking, a high reading is seen as bullish for the US Dollar (USD), while a low reading is seen as bearish.
Read more.Last release: Tue Jan 13, 2026 13:30
Frequency: Monthly
Actual: 2.7%
Consensus: 2.7%
Previous: 2.7%
Source: US Bureau of Labor Statistics
The US Federal Reserve (Fed) has a dual mandate of maintaining price stability and maximum employment. According to such mandate, inflation should be at around 2% YoY and has become the weakest pillar of the central bank’s directive ever since the world suffered a pandemic, which extends to these days. Price pressures keep rising amid supply-chain issues and bottlenecks, with the Consumer Price Index (CPI) hanging at multi-decade highs. The Fed has already taken measures to tame inflation and is expected to maintain an aggressive stance in the foreseeable future.
Author

Christian Borjon Valencia
FXStreet
Markets analyst, news editor, and trading instructor with over 14 years of experience across FX, commodities, US equity indices, and global macro markets.