|

GBP/USD climbs above 1.2050 post US data, UK-EU Northern Ireland deal

  • GBP/USD got bolstered by a soft US Dollar and a risk-on impulse.
  • Durable Good Orders collapsed, with US companies feeling the pain of tighter monetary policy.
  • The EU and the UK had agreed to a deal in Northern Ireland, which could boost the GBP.

GBP/USD is recovering some ground after hitting a daily low of 1.1921 as speculations for the Brexit deal struck in Northern Ireland grow, which could bolster the Pound Sterling (GBP) in the near term. In addition, worse-than-expected US economic data are a headwind for the greenback. At the time of typing, the GBP/USD is trading at 1.2052, above its opening price by 0.65%.

The US Dollar (USD) is weakening across the board on a dismal Durable Goods Orders report. Durable Good Orders for January plunged below expectations, -4.5%, below the last month’s revised 5.1% figures, the lowest reading since April 2020. The so-called core orders excluding transport rose by 0.7%, above December’s -.0.4% drop.

The US Dollar Index (DXY), a measure of the buck’s value against a basket of rivals, edged down 0.62%, at 104.594, retracing last Friday’s gains sponsored by a jump in the preferred’s gauge for inflation by the US Federal Reserve (FED), the Core PCE. Following goods orders data, the DXY dropped from around 105.100 toward current quotes.

In the meantime, the latest headlines that the United Kingdom (UK) and the Eurozone (EU) agreed to a deal in Northern Ireland sponsored a leg-up in the GBP/USD, as witnessed by the 1-Hour chart. After seesawing around the daily pivot at 1.1970, the GBP/USD jumped around 80 pips, though hit a daily high of 1.2054.

Sources on both sides told the BBC that the UK and EU had reached a post-Brexit trade agreement for Northern Ireland. Later, the EU’s President Ursula von der Leyen and the UK Prime Minister Rishi Sunak are expected to host a press conference at around 15:30 GMT. Details on the agreement will be released later.

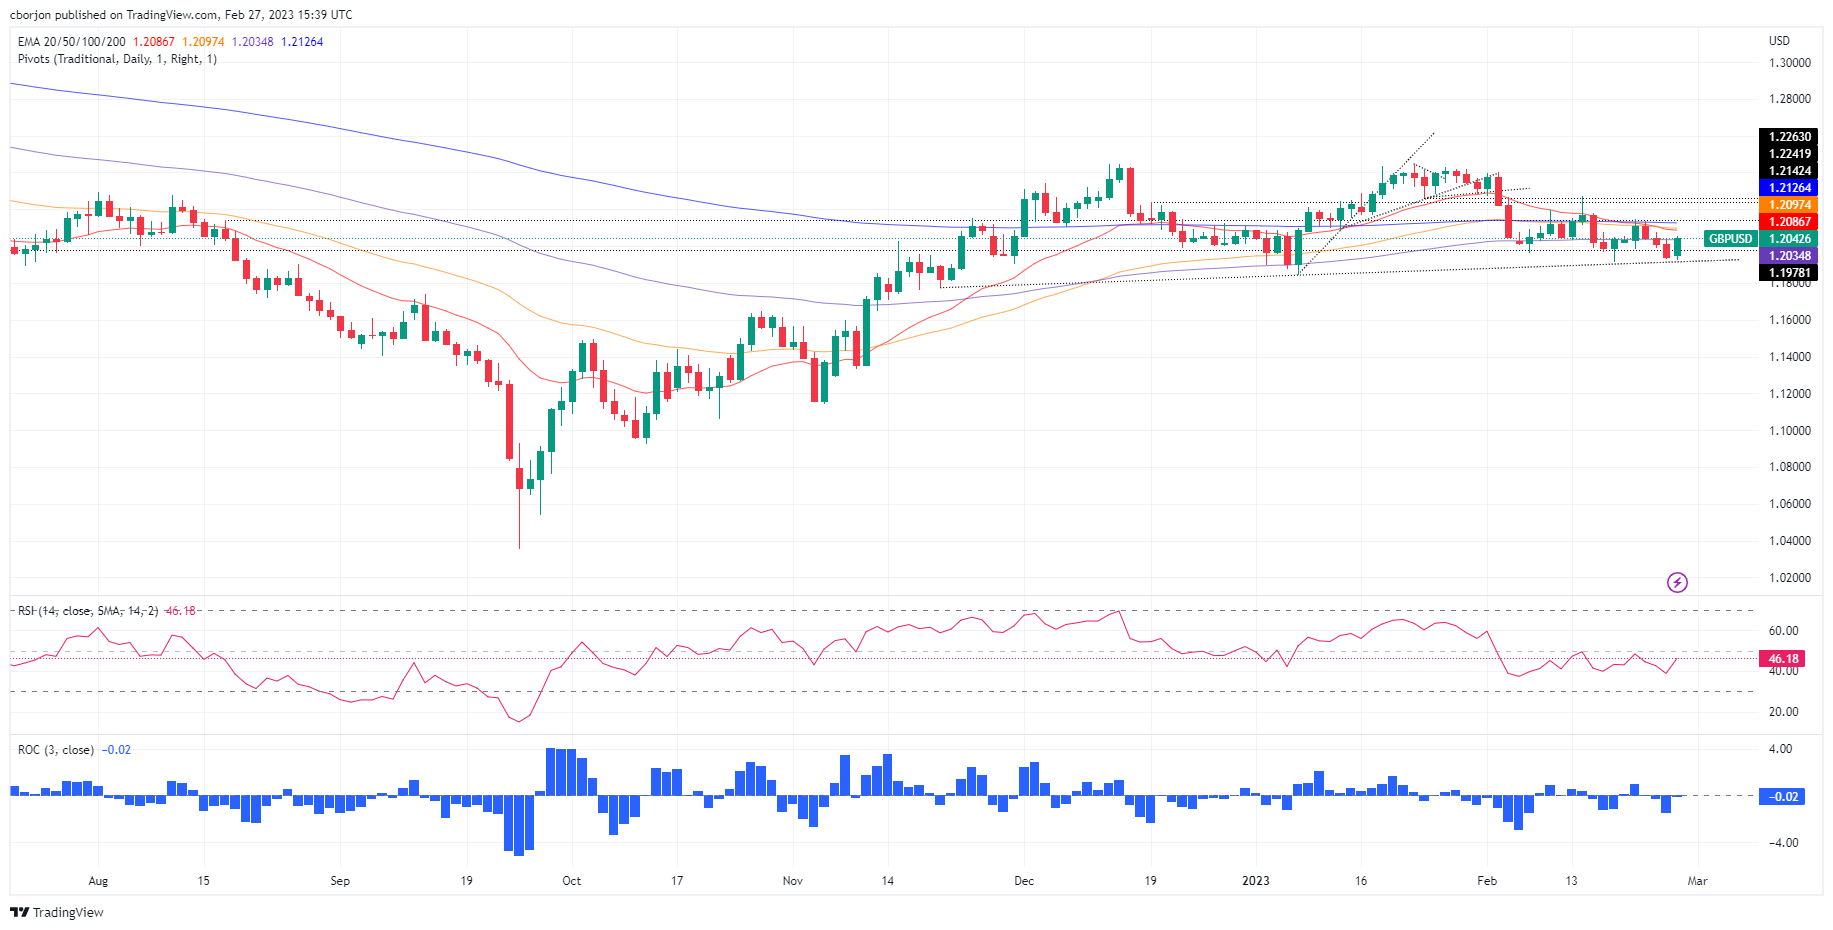
GBP/USD technical analysis

From a daily chart perspective, the GBP/USD formed a bullish engulfing candle, which could send the pair rallying toward the 20-day EMA at 1.2088 before testing the 50-day EMA at 1.2097, shy of the 1.2100 mark. A breach of the latter would expose the important 200-day EMA at 12126. As an alternate scenario, the GBP/USD could fall toward the last week’s low at 1.1927 before testing 1.1900.

GBP/USD

Overview
Today last price1.2054
Today Daily Change0.0111
Today Daily Change %0.93
Today daily open1.1943
 
Trends
Daily SMA201.2109
Daily SMA501.2149
Daily SMA1001.1941
Daily SMA2001.193
 
Levels
Previous Daily High1.2042
Previous Daily Low1.1928
Previous Weekly High1.2148
Previous Weekly Low1.1928
Previous Monthly High1.2448
Previous Monthly Low1.1841
Daily Fibonacci 38.2%1.1972
Daily Fibonacci 61.8%1.1999
Daily Pivot Point S11.19
Daily Pivot Point S21.1858
Daily Pivot Point S31.1787
Daily Pivot Point R11.2014
Daily Pivot Point R21.2085
Daily Pivot Point R31.2127

Author

Christian Borjon Valencia

Markets analyst, news editor, and trading instructor with over 14 years of experience across FX, commodities, US equity indices, and global macro markets.

More from Christian Borjon Valencia
Share:

Editor's Picks

EUR/USD slumps below 1.1750 as USD benefits from risk-aversion

EUR/USD comes under renewed bearish pressure in the European session and trades below 1.1750 following a recovery attempt earlier in the day. The US Dollar gathers strength and weighs on the pair as investors seek refuge in the wake of Israel and the United States' joint attack on Iran.

GBP/USD targets 1.3500 barrier near moving averages

GBP/USD rebounds from the daily losses, trading around 1.3450 during the Asian hours on Monday. The technical analysis of the daily chart indicates an ongoing bearish bias, as the pair trades within a descending channel pattern.

Gold surges on safe-haven demand, rises above $5,400

Gold benefits from intense risk-aversion on Monday and climbs above $5,400, setting a fresh monthly-high in the process. Tensions in the Middle East remain high as Israel and Hezbollah continue to exchange strikes following the US-Israel joint attack on Iran over the weekend.

Bitcoin, Ethereum and Ripple under pressure as key supports face breakdown risk

Bitcoin, Ethereum, and Ripple prices trade on the back foot at the start of this week on Monday, after extending losses in the previous week. BTC is on the brink of a breakdown, ETH is capped below key resistance, and XRP risks a crack of the trendline.

The market is paying for insurance, not apocalypse

As expected, this morning felt less like a Monday market open and more like a fire drill. Futures screens flickered red. S&P contracts down almost 1%. Nasdaq off 1.2%. Brent leaped 13% through $80. Gold rose 1.6% toward $5350 before paring some gains. The dollar is strutting mildly. The Swiss franc is quietly doing what it always does in a storm, catching some safe-haven flows.

Pi Network Price Forecast: Core team offloads supply, weighing on PI recovery

Pi Network  hovers below $0.1700, broadly steady at press time on Monday, attempting a recovery after a 2% loss the previous day. Sunday’s decline aligned with nearly 49 million PI tokens offloaded by the Pi Foundation, implying a spike in supply pressure that capped the prevailing four-day recovery.