GBP/JPY trying for a break below 181.50 heading into the Friday close
- GBP/JPY trading into the 181.50 handle, on the low side for the week.
- The Pound Sterling lost ground across the board this week after a dovish twist from the BoE.
- The BoJ continues to maintain their easy monetary policy stance.

The GBP/JPY is ticking into the south side of the 181.50 handle after the Pound Sterling (GBP) failed to recover any meaningful ground from Thursday's backslide. The Guppy is down almost a full percentage point this week.
The Bank of England (BoE) struck a notably dovish tone this Thursday, standing pat on its benchmark interest rate after inflation data for the UK came in much softer than expected earlier this week. The BoE is holding its reference rate at 5.25% for the time being, and it's increasingly looking like a 'none and done' scenario for the UK's rate hike cycle.
The Bank of Japan (BoJ) also held its main policy rate, maintaining a negative rate regime at -0.1%. The BoJ is keeping steady on its hyper-easy monetary policy mechanisms, and the BoJ is determined to try and keep Japanese inflation up above the 2% mark.
Japanese inflation is currently riding on the high end of policymakers' target level, but Japanese inflation is broadly expected to plummet in the coming months, and the BoJ is not in a rush to start reversing their negative rate policy until the central bank is assured that inflation will remain above their minimum target.
Read more:
BoE holds interest rate steady at 5.25% in split vote
BoJ’s Ueda: Could consider policy change when achievement of 2% inflation is in sight
The economic calendar for the upcoming week is looking sparsely-populated through the first half of the week, and the only notable release on the data docket will be the BoJ's meeting minutes on Tuesday, which will reveal the Japanese central bank's inner monologue on the interest rate decision that just passed.
GBP/JPY technical outlook
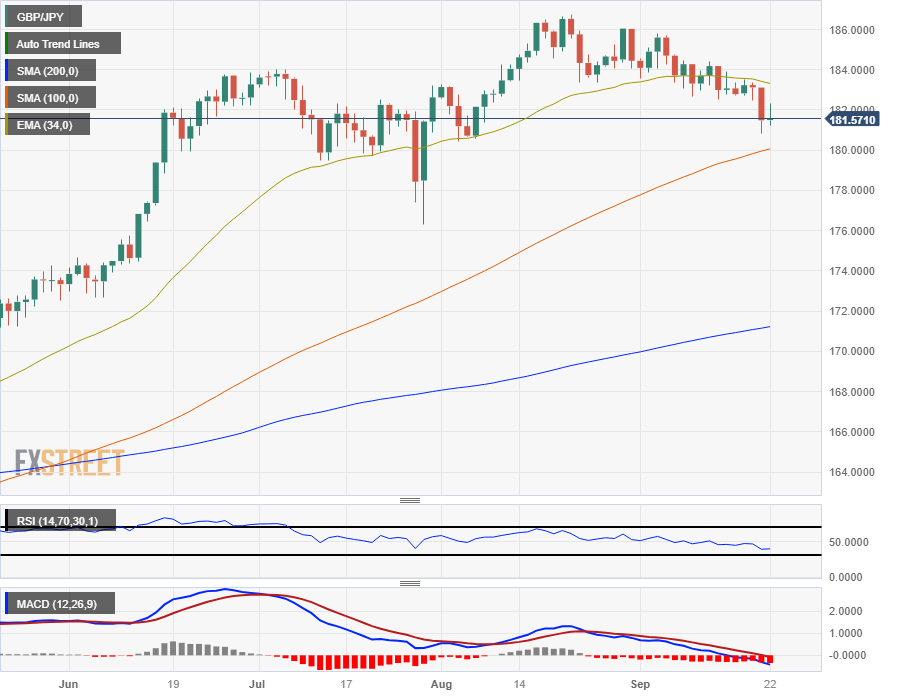
The GBP/JPY failed to hold onto rebound gains, etching in a high of 182.30 on Friday before settling lower, looking to establish a break of 181.50 to close out the week's trading session.
The pair remains firmly bearish below the 200-hour Simple Moving Average (SMA) which is currently pricing in resistance from 183.00.
Daily candlesticks see the Guppy waffling towards the 100-day SMA near the 180.00 major handle, and the pair is down almost 3% from August's peak near 186.70.
Investors will be keeping an eye out for a sustained bearish push into the 100-day SMA, where a recovery rally could see a rebound back into the 34-day Exponential Moving Average that is currently capping off upside potential and sitting just north of near-term highs near 183.30.
GBP/JPY daily chart
GBP/JPY technical levels
Author

Joshua Gibson
FXStreet
Joshua joins the FXStreet team as an Economics and Finance double major from Vancouver Island University with twelve years' experience as an independent trader focusing on technical analysis.
















