|
GBP/JPY Technical Analysis: Testing 148.00 early
- The GBP/JPY pair is popping to test the 148.00 key barrier early on Wednesday after headlines broke that the UK and the EU may be much closer to achieving a workable trade deal than previously thought.
- Overbought readings are beginning to show on intraday indicators, implying the bullish push may face some downward pressure before the trend can resume.
- Wednesday will also be seeing inflation data for the UK at 08:30 GMT, and GBP traders should be braced for a bearish turnaround if the numbers fail to meet expectations.

GBP/JPY Chart, 15-Minute
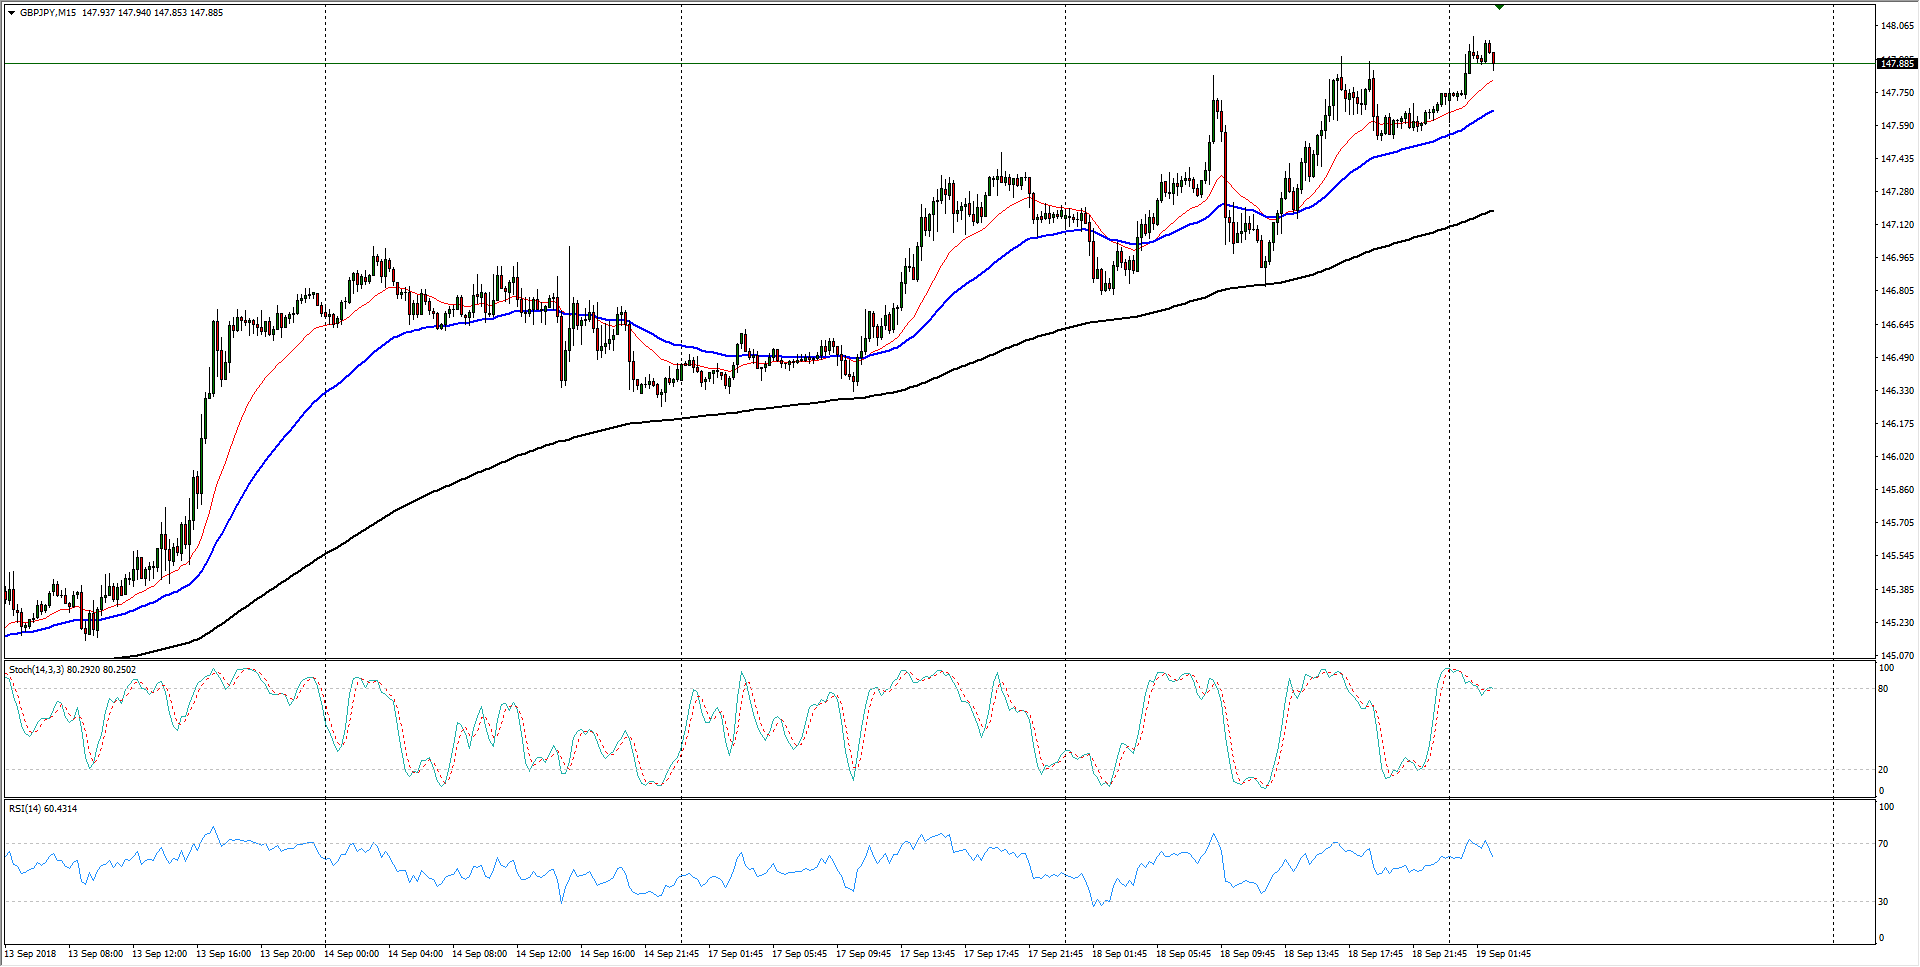
| Spot rate | 147.88 |
| Relative change | 0.11% |
| High | 148.01 |
| Low | 147.60 |
| Trend | Bullish |
| Support 1 | 147.20 (50-hour EMA) |
| Support 2 | 146.32 (current week low) |
| Support 3 | 145.84 (200-hour EMA) |
| Resistance 1 | 148.00 (major technical level) |
| Resistance 2 | 149.31 (July swing high) |
| Resistance 3 | 150.00 (major technical level; May swing high) |
Author

Joshua Gibson
FXStreet
Joshua joins the FXStreet team as an Economics and Finance double major from Vancouver Island University with twelve years' experience as an independent trader focusing on technical analysis.
More from Joshua Gibson


