GBP/JPY Price Forecast: Pound crawls towards 204.00 on Yen weakness
- The Pound retraced previous losses and reached session highs near 204.00
- Rumours of a stimulus package in Japan have sent the Yen lower on Thursday.
- GBP/JPY is testing the top of a wedge pattern, at the 202.75 area.

The British Pound is has reverted to Wednesday’s pullback and trades at the upper range of the 203.00s, as news that the new Japanese government should be preparing a large stimulus program is hammering the Yen on Thursday.
Reuters has reported, citing a government document, that Prime Minister Takaichi’s cabinet would be planning a USD 90 billion stimulus package to support households against the impact of increasing prices. This stimulus would come less than a year after a similar one introduced in 2024 and is expected to add pressure on the already strained public finances.
Technical analysis: Testing resistance at the 203.75 area
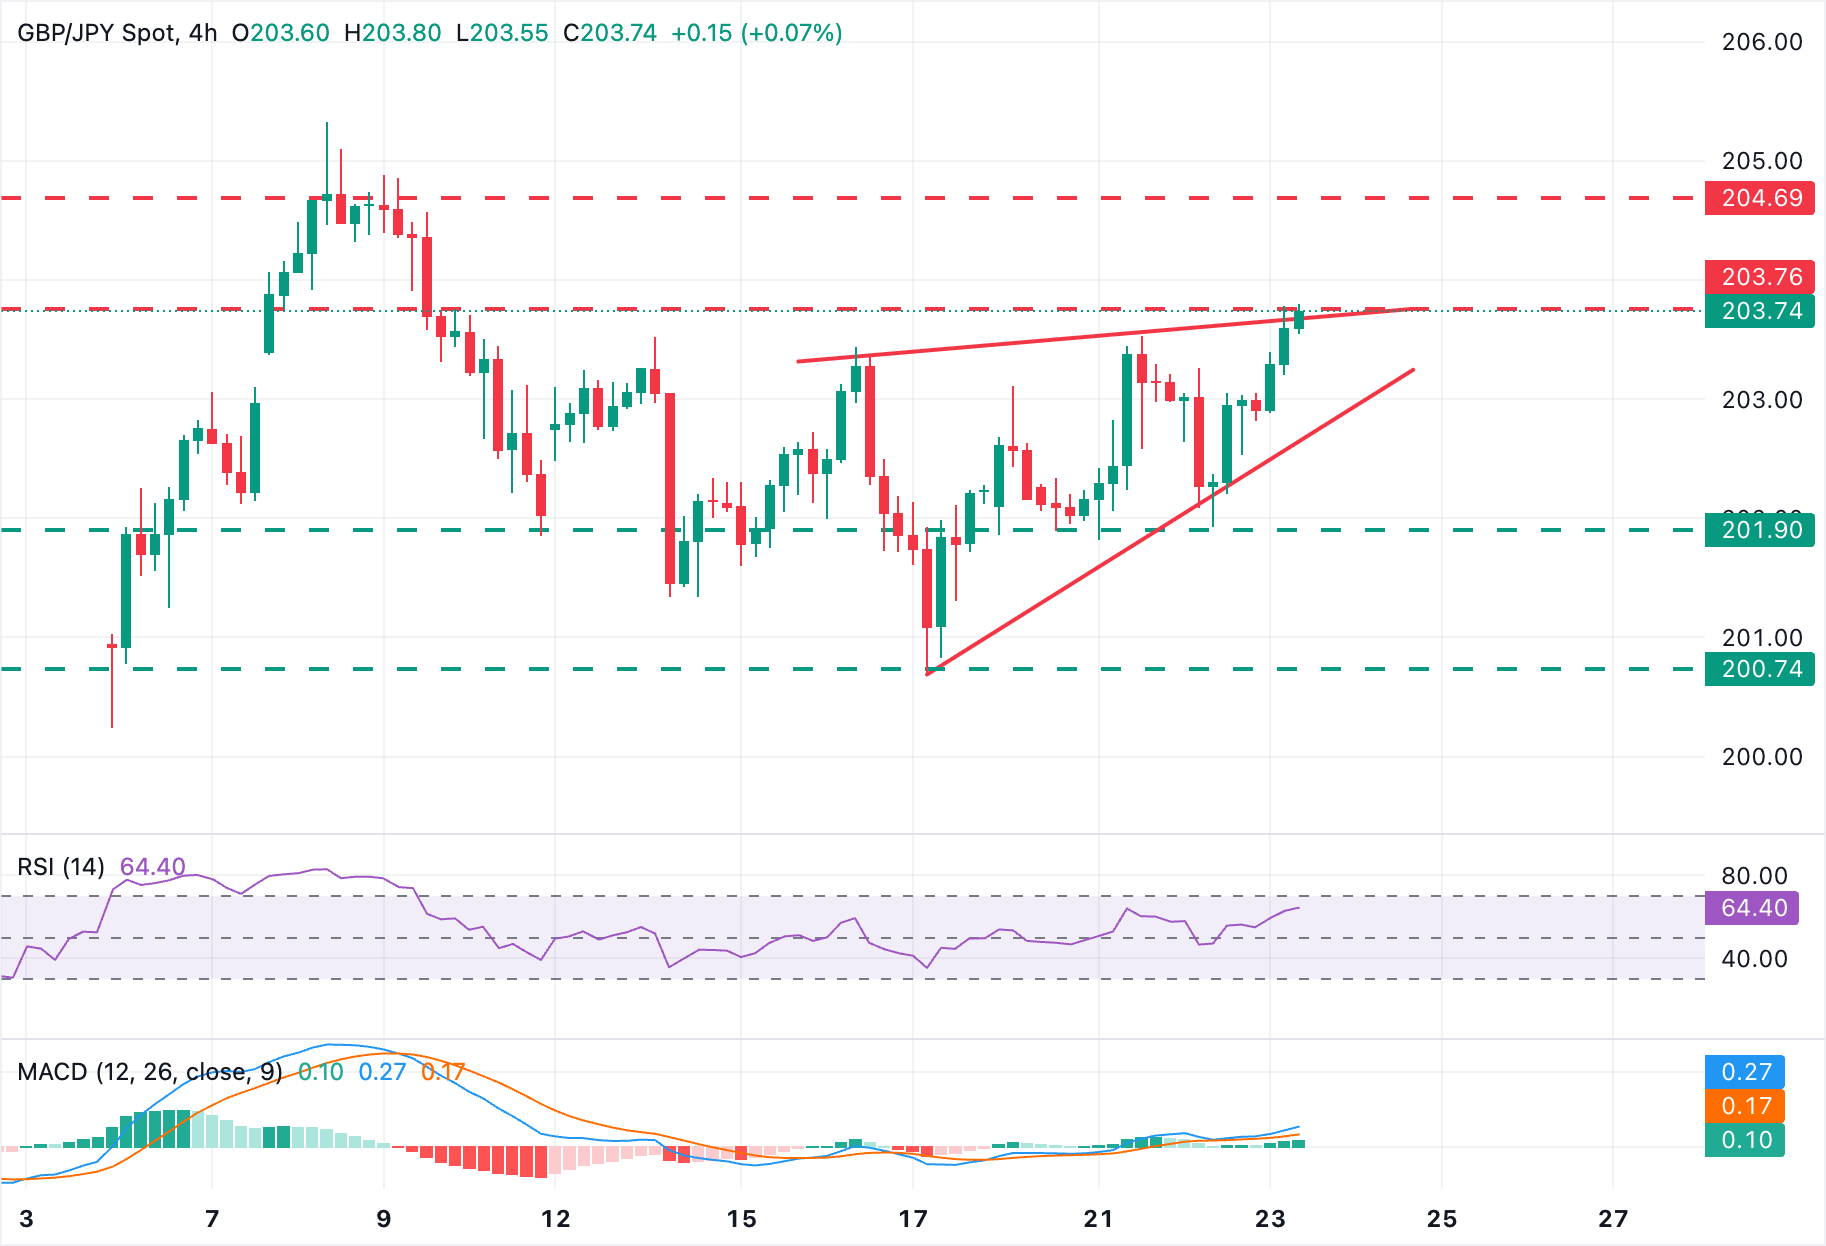
The technical picture shows the bulls in control and trying to confirm above the resistance area between the top of an ascending wedge pattern and the October 10 high, at the 203.75 area. The 4-hour RSI remains well above the 50 level, and the MACD is about to perform a bullish cross, which reinforces the positive outlook.
A successful break of that resistance area would shift the focus to the October 9 high, at 204.85, ahead of the year-to-date high, at 205.33.
To the downside, trendline support is at the 202.80 area, ahead of the October 21 and 22 lows, in the area of 201.90. Further down, the key 202.790 support (October 17 low) emerges as the next plausible target.
Japanese Yen Price Today
The table below shows the percentage change of Japanese Yen (JPY) against listed major currencies today. Japanese Yen was the strongest against the Swiss Franc.
| USD | EUR | GBP | JPY | CAD | AUD | NZD | CHF | |
|---|---|---|---|---|---|---|---|---|
| USD | 0.17% | 0.12% | 0.52% | -0.01% | -0.26% | -0.07% | 0.28% | |
| EUR | -0.17% | -0.05% | 0.32% | -0.17% | -0.42% | -0.24% | 0.12% | |
| GBP | -0.12% | 0.05% | 0.37% | -0.11% | -0.37% | -0.19% | 0.17% | |
| JPY | -0.52% | -0.32% | -0.37% | -0.51% | -0.74% | -0.58% | -0.21% | |
| CAD | 0.00% | 0.17% | 0.11% | 0.51% | -0.24% | -0.06% | 0.29% | |
| AUD | 0.26% | 0.42% | 0.37% | 0.74% | 0.24% | 0.18% | 0.54% | |
| NZD | 0.07% | 0.24% | 0.19% | 0.58% | 0.06% | -0.18% | 0.36% | |
| CHF | -0.28% | -0.12% | -0.17% | 0.21% | -0.29% | -0.54% | -0.36% |
The heat map shows percentage changes of major currencies against each other. The base currency is picked from the left column, while the quote currency is picked from the top row. For example, if you pick the Japanese Yen from the left column and move along the horizontal line to the US Dollar, the percentage change displayed in the box will represent JPY (base)/USD (quote).
Author

Guillermo Alcala
FXStreet
Graduated in Communication Sciences at the Universidad del Pais Vasco and Universiteit van Amsterdam, Guillermo has been working as financial news editor and copywriter in diverse Forex-related firms, like FXStreet and Kantox.


