GBP/JPY Price Forecast: Bulls keep the upper hand as pair approaches key resistance level
- The GBP/JPY pair steadies as buyers attempt to break key resistance at 196.00-197.00.
- GBP/JPY remains in a bullish structure, supported by both the 50-day and 200-day moving averages, as well as upward momentum.
- Failure to overcome long-term resistance could trigger a pullback to 194.00.

The British Pound (GBP) remains near multi-month highs against the Japanese Yen (JPY) on Monday, with the GBP/JPY pair close to testing a key Fibonacci resistance zone. After bottoming out in late August 2024 near 180.09, the pair has steadily recovered, and recent price action suggests buyers are attempting to break above 197.00, the critical 61.8% Fibonacci retracement level of the July-August 2023 downtrend.
The sharp decline that unfolded between early July and late August last year saw GBP/JPY drop from a swing high of 208.11 to a low of 180.09. Since then, the recovery has been methodical, encountering resistance and support at several key retracement levels. Most notably, the 50.0% level at 194.10 offered temporary resistance in April and May before bulls managed a firm close above it in early June.
At the time of writing, the pair trades near 195.77, just below the 61.8% retracement level at 197.41. A decisive daily close above this area would mark a major technical breakout, shifting attention to the 78.6% retracement at 202.12, a level last seen in August 2024. On the downside, the 20-day Simple Moving Average (SMA) at 194.23 offers dynamic support, with the 50.0% Fib. zone (194.10) is also providing structural backing for the current trend.
Momentum indicators support the bullish bias. The Relative Strength Index (RSI) on the daily chart is trending higher and currently stands at 59.89, well above neutral but not yet in overbought territory. This suggests there is still room for further upside before momentum becomes stretched.
However, traders should remain alert to divergence signals or sudden RSI reversals, especially as price approaches overhead resistance.
Bulls will look for a sustained break above 197.41 to extend the current uptrend. If that occurs, the next resistance lies near 202.12, followed by the 208.11 swing high. On the other hand, failing to break the 61.8% barrier could trigger a pullback toward the 50.0% retracement and the 20-day SMA, with further support seen at the 38.2% level, around 190.79.
GBP/JPY daily chart
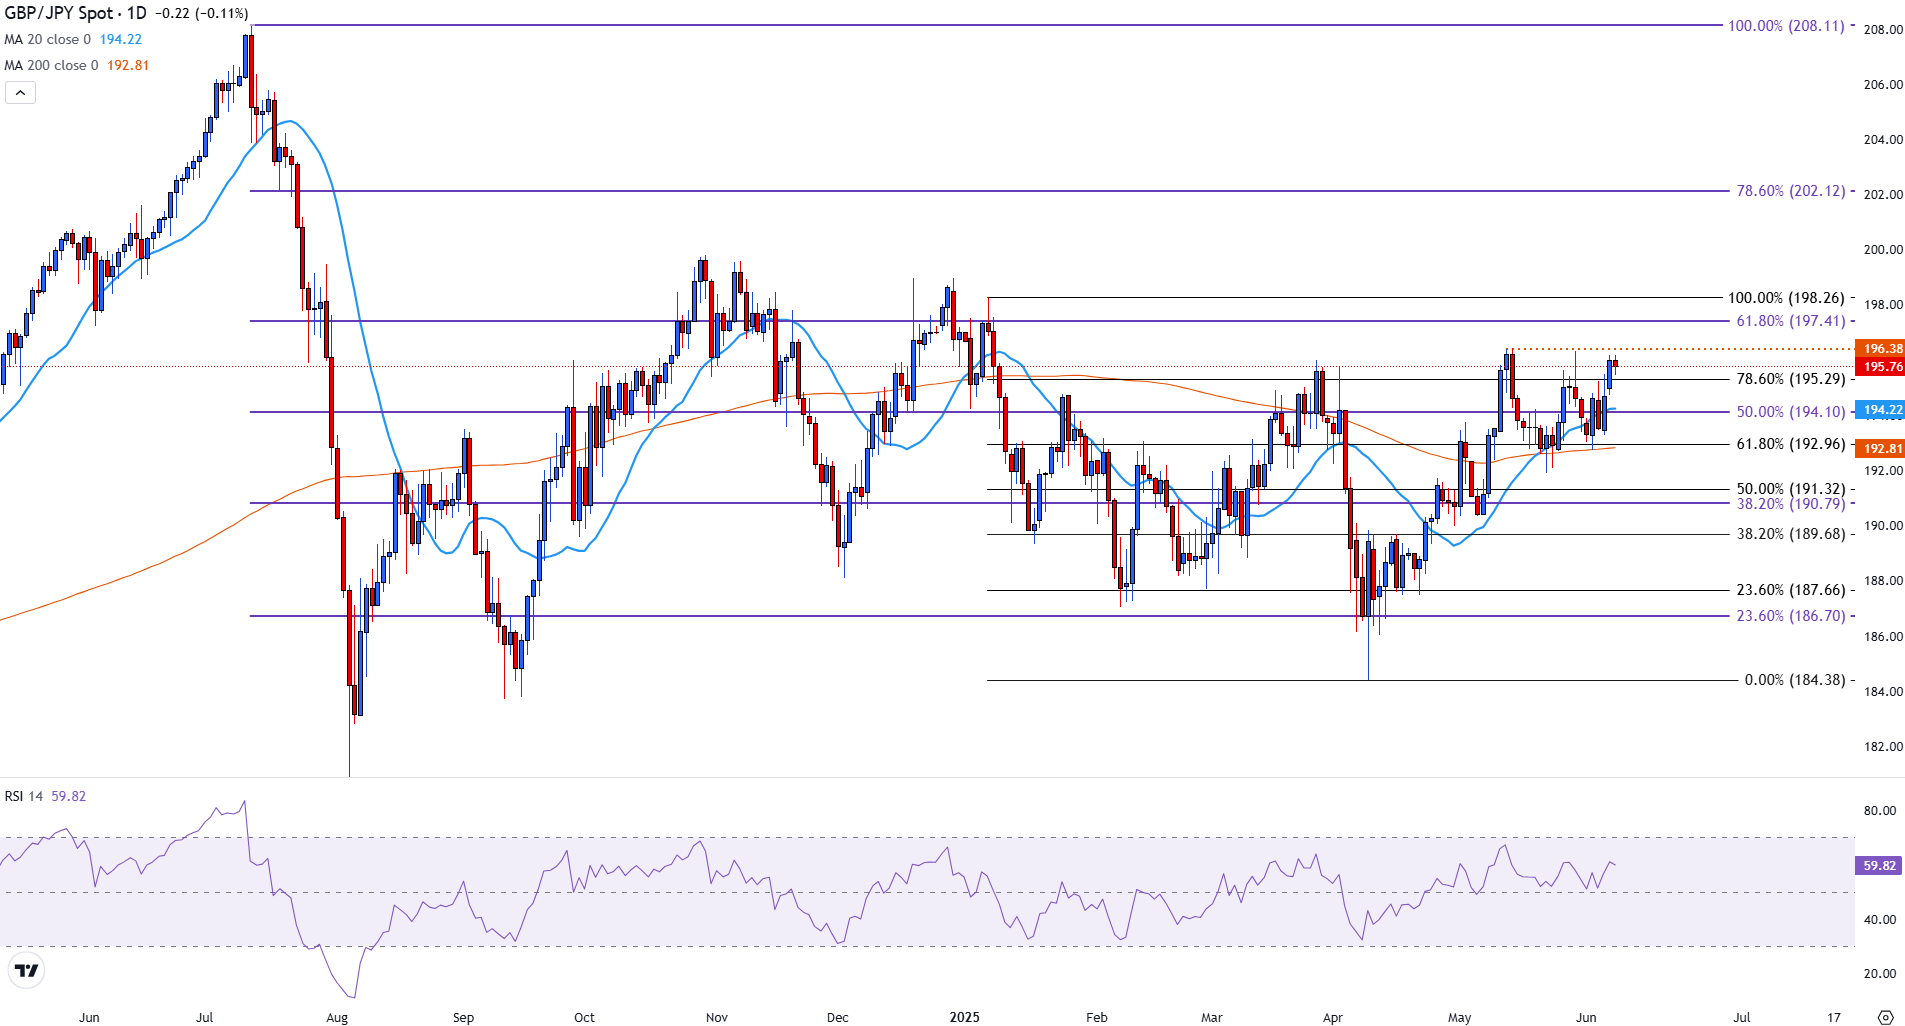
GBP/JPY remains in a bullish structure, supported by both the 50 and 200-day Simple Moving Averages and upward momentum. A clean breakout above 197.41 would validate the recovery and could set the stage for a retest of the psychological 200.00 handle. However, caution is warranted near this resistance zone as market volatility could increase if profit-taking emerges.
Japanese Yen FAQs
The Japanese Yen (JPY) is one of the world’s most traded currencies. Its value is broadly determined by the performance of the Japanese economy, but more specifically by the Bank of Japan’s policy, the differential between Japanese and US bond yields, or risk sentiment among traders, among other factors.
One of the Bank of Japan’s mandates is currency control, so its moves are key for the Yen. The BoJ has directly intervened in currency markets sometimes, generally to lower the value of the Yen, although it refrains from doing it often due to political concerns of its main trading partners. The BoJ ultra-loose monetary policy between 2013 and 2024 caused the Yen to depreciate against its main currency peers due to an increasing policy divergence between the Bank of Japan and other main central banks. More recently, the gradually unwinding of this ultra-loose policy has given some support to the Yen.
Over the last decade, the BoJ’s stance of sticking to ultra-loose monetary policy has led to a widening policy divergence with other central banks, particularly with the US Federal Reserve. This supported a widening of the differential between the 10-year US and Japanese bonds, which favored the US Dollar against the Japanese Yen. The BoJ decision in 2024 to gradually abandon the ultra-loose policy, coupled with interest-rate cuts in other major central banks, is narrowing this differential.
The Japanese Yen is often seen as a safe-haven investment. This means that in times of market stress, investors are more likely to put their money in the Japanese currency due to its supposed reliability and stability. Turbulent times are likely to strengthen the Yen’s value against other currencies seen as more risky to invest in.
Author

Tammy Da Costa, CFTe®
FXStreet
Tammy is an economist and market analyst with a deep passion for financial markets, particularly commodities and geopolitics.


