GBP/JPY Price Forecast: Bulls defend key 200.00 support amid fading momentum
- GBP/JPY trades slightly lower below 201.00, set for a second straight weekly loss.
- Price action hovers around the 50-day SMA while holding above the 100-day SMA and key 200.00 support.
- Momentum indicators point to consolidation with a mild bearish bias.

GBP/JPY trades slightly lower on Friday, hovering around 200.75 at the time of writing, and remains on track for its second consecutive weekly loss. The pair has stabilized after sharp mid-week selling that drove prices to a one-month low, filling the bullish gap from October 6.
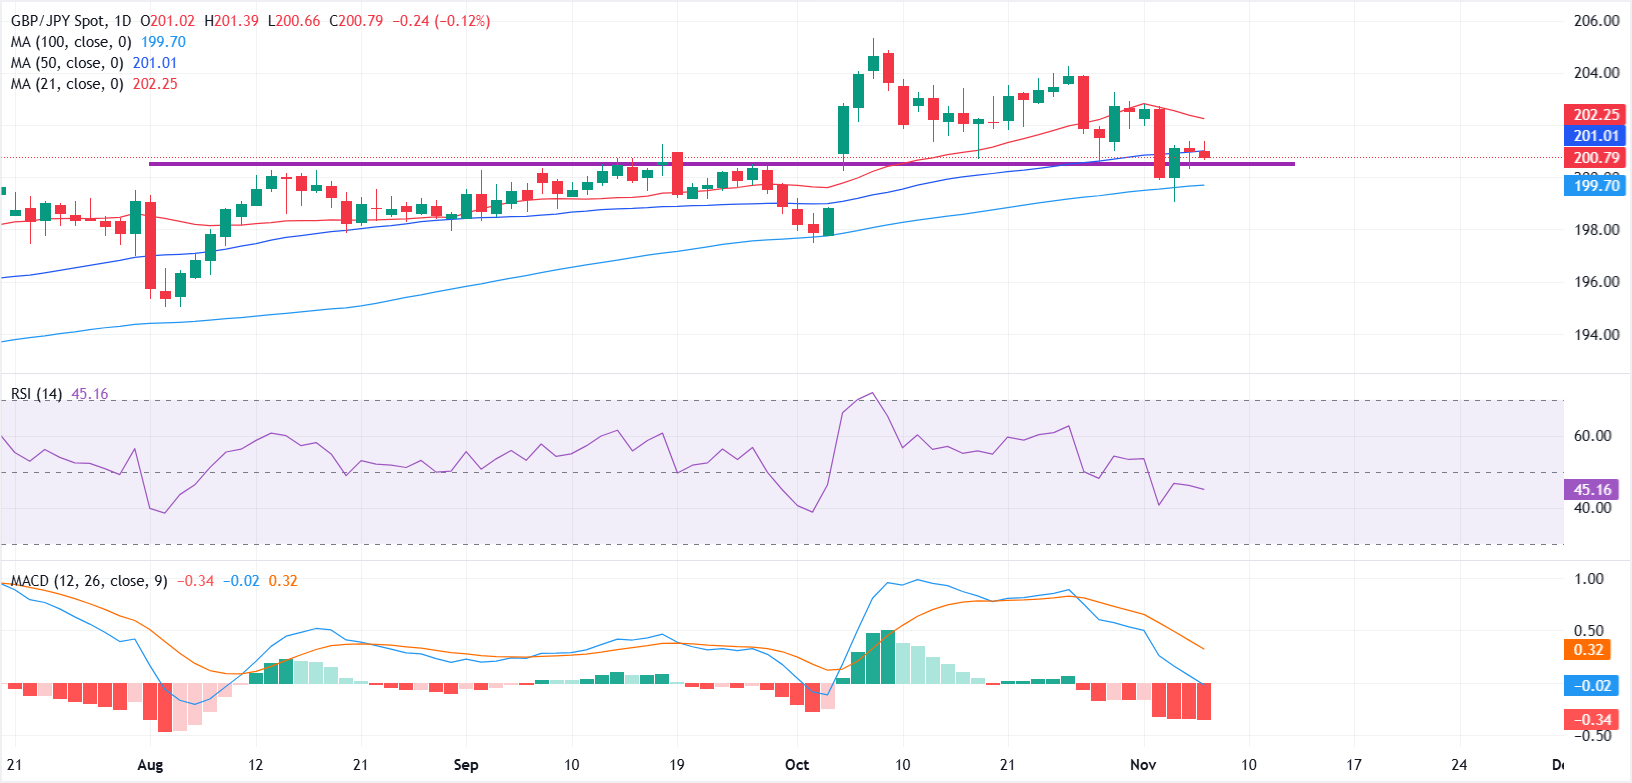
On the daily chart, the cross is currently testing the 50-day Simple Moving Average (SMA) near 201.00 while holding just above the 100-day SMA at 199.70, which aligns closely with the weekly low around 199.00.
The immediate support zone lies at 200.00- 200.50, a region that previously acted as resistance and now serves as a key floor. Holding above this zone keeps the broader bias constructive, while a decisive break below 200.00 could hand near-term control to sellers and open the door for a deeper pullback toward 199.00 and 198.50.
On the upside, the 21-day SMA around 202.25 acts as the first resistance, followed by 203.50. A sustained move above these levels would signal renewed bullish momentum.
The Relative Strength Index (RSI) hovers near 46, reflecting neutral momentum with a mild bearish tilt as buyers struggle to regain control. Meanwhile, the Moving Average Convergence Divergence (MACD) remains below its signal line with the histogram still in negative territory, confirming fading bullish momentum and a cautious tone in the near term.
Together, these indicators suggest consolidation around current levels with bears holding a slight edge unless the pair reclaims the 21-day SMA at 202.25.
Pound Sterling FAQs
The Pound Sterling (GBP) is the oldest currency in the world (886 AD) and the official currency of the United Kingdom. It is the fourth most traded unit for foreign exchange (FX) in the world, accounting for 12% of all transactions, averaging $630 billion a day, according to 2022 data. Its key trading pairs are GBP/USD, also known as ‘Cable’, which accounts for 11% of FX, GBP/JPY, or the ‘Dragon’ as it is known by traders (3%), and EUR/GBP (2%). The Pound Sterling is issued by the Bank of England (BoE).
The single most important factor influencing the value of the Pound Sterling is monetary policy decided by the Bank of England. The BoE bases its decisions on whether it has achieved its primary goal of “price stability” – a steady inflation rate of around 2%. Its primary tool for achieving this is the adjustment of interest rates. When inflation is too high, the BoE will try to rein it in by raising interest rates, making it more expensive for people and businesses to access credit. This is generally positive for GBP, as higher interest rates make the UK a more attractive place for global investors to park their money. When inflation falls too low it is a sign economic growth is slowing. In this scenario, the BoE will consider lowering interest rates to cheapen credit so businesses will borrow more to invest in growth-generating projects.
Data releases gauge the health of the economy and can impact the value of the Pound Sterling. Indicators such as GDP, Manufacturing and Services PMIs, and employment can all influence the direction of the GBP. A strong economy is good for Sterling. Not only does it attract more foreign investment but it may encourage the BoE to put up interest rates, which will directly strengthen GBP. Otherwise, if economic data is weak, the Pound Sterling is likely to fall.
Another significant data release for the Pound Sterling is the Trade Balance. This indicator measures the difference between what a country earns from its exports and what it spends on imports over a given period. If a country produces highly sought-after exports, its currency will benefit purely from the extra demand created from foreign buyers seeking to purchase these goods. Therefore, a positive net Trade Balance strengthens a currency and vice versa for a negative balance.
Author

Vishal Chaturvedi
FXStreet
I am a macro-focused research analyst with over four years of experience covering forex and commodities market. I enjoy breaking down complex economic trends and turning them into clear, actionable insights that help traders stay ahead of the curve.


