GBP/JPY Price Analysis: Tests ascending channel’s lower boundary near 192.00
- GBP/JPY tests immediate support at the lower boundary of the ascending channel around the 192.30 level.
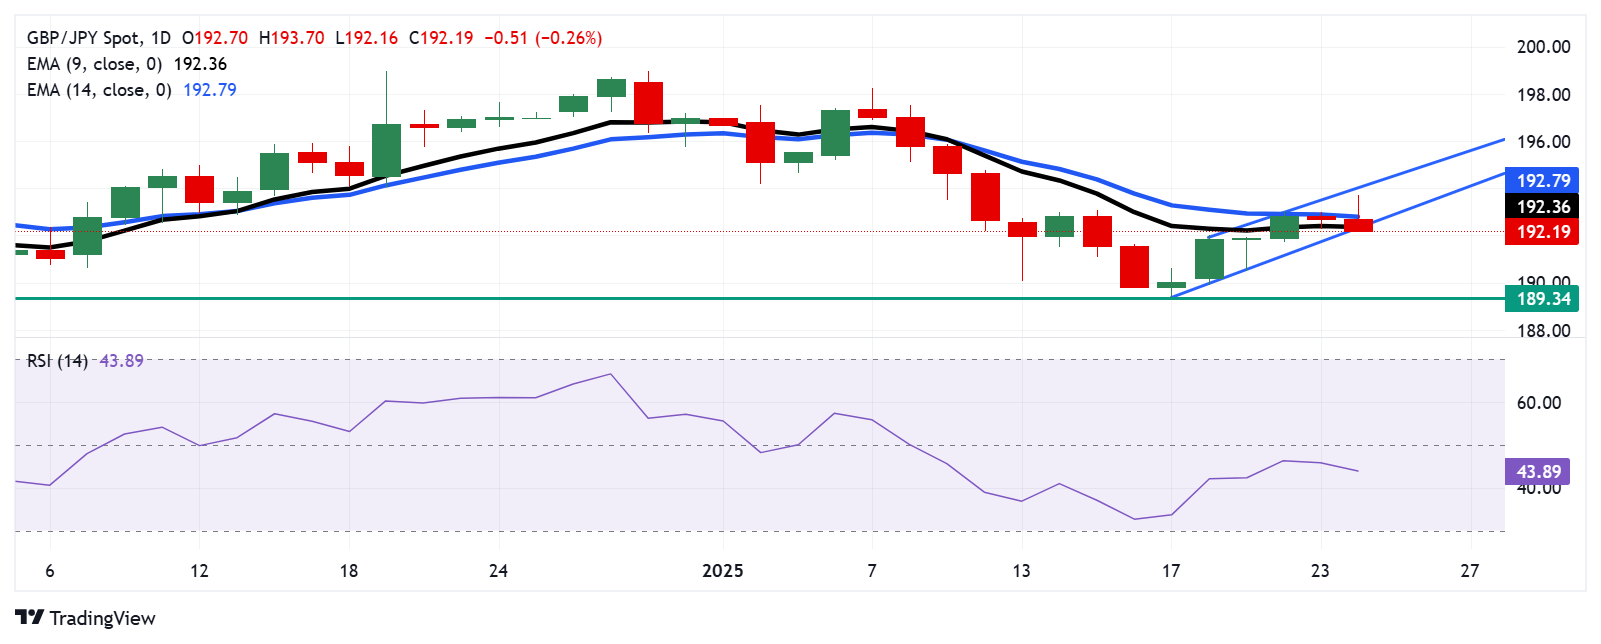
- The 14-day RSI remains just below the 50 mark, suggesting that bearish momentum is still in play.
- The currency cross faces primary resistance at the 9-day EMA at 192.36, followed by the 14-day EMA at 192.79.

The GBP/JPY cross remains subdued for the second successive session, trading around 192.30 during the Asian hours on Friday. An analysis of the daily chart suggests the formation of an ascending channel pattern, indicating a potential bullish bias.
The 14-day Relative Strength Index (RSI), a key momentum indicator, remains just below the 50 level, signaling that bearish momentum is still in play. A move above the 50 mark would confirm the shift toward a bullish bias. Additionally, the GBP/JPY cross trades below the 9- and 14-day Exponential Moving Averages (EMAs), suggesting weaker short-term price momentum.
On the downside, the GBP/JPY cross tests immediate support at the lower boundary of the ascending channel around the 192.30 level. A break below this support could strengthen the bearish bias, putting downward pressure on the currency cross and potentially driving it toward the seven-week low at 189.34, recorded on January 17.
The GBP/JPY cross faces primary resistance at the 9-day EMA at 192.36, followed by the 14-day EMA at 192.79. A move above the latter could boost short-term price momentum, supporting the currency cross to test the upper boundary of the ascending channel at the 194.00 level.
GBP/JPY: Daily Chart
British Pound PRICE Today
The table below shows the percentage change of British Pound (GBP) against listed major currencies today. British Pound was the weakest against the Japanese Yen.
| USD | EUR | GBP | JPY | CAD | AUD | NZD | CHF | |
|---|---|---|---|---|---|---|---|---|
| USD | -0.32% | -0.35% | -0.56% | -0.27% | -0.53% | -0.54% | -0.22% | |
| EUR | 0.32% | -0.03% | -0.24% | 0.05% | -0.22% | -0.22% | 0.10% | |
| GBP | 0.35% | 0.03% | -0.21% | 0.08% | -0.19% | -0.19% | 0.13% | |
| JPY | 0.56% | 0.24% | 0.21% | 0.28% | 0.00% | -0.01% | 0.32% | |
| CAD | 0.27% | -0.05% | -0.08% | -0.28% | -0.27% | -0.27% | 0.06% | |
| AUD | 0.53% | 0.22% | 0.19% | -0.00% | 0.27% | -0.00% | 0.30% | |
| NZD | 0.54% | 0.22% | 0.19% | 0.00% | 0.27% | 0.00% | 0.31% | |
| CHF | 0.22% | -0.10% | -0.13% | -0.32% | -0.06% | -0.30% | -0.31% |
The heat map shows percentage changes of major currencies against each other. The base currency is picked from the left column, while the quote currency is picked from the top row. For example, if you pick the British Pound from the left column and move along the horizontal line to the US Dollar, the percentage change displayed in the box will represent GBP (base)/USD (quote).
Author

Akhtar Faruqui
FXStreet
Akhtar Faruqui is a Forex Analyst based in New Delhi, India. With a keen eye for market trends and a passion for dissecting complex financial dynamics, he is dedicated to delivering accurate and insightful Forex news and analysis.


