GBP/JPY Price Analysis: Stays bearish despite facing support around 187.00 as double top looms
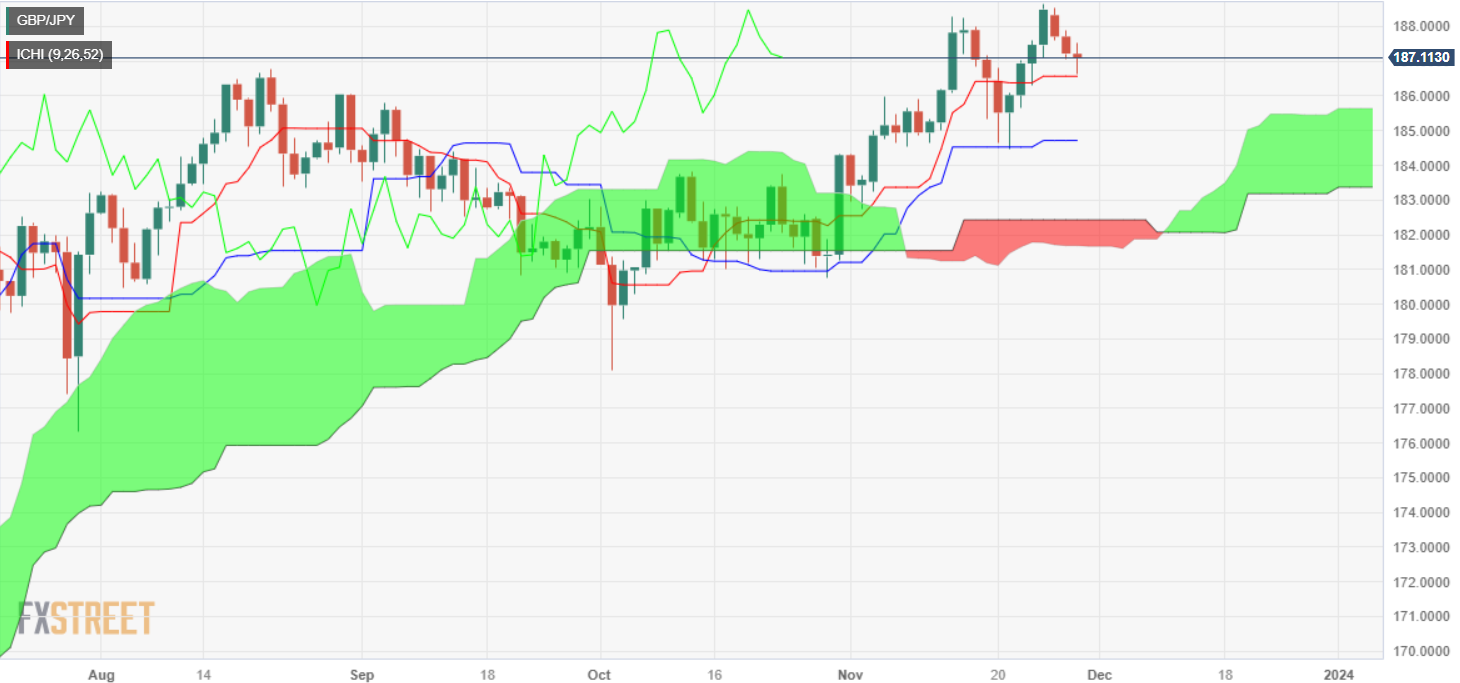
- GBP/JPY daily chart depicts the formation of double top chart pattern.
- If the pair drops below the Kijun-Sen, expect further downside toward 180.76, due to double top’s confirmation.
- Buyers maintaining the exchange rate above 187.00, could increase the odds of challenging the YTD high.

The GBP/JPY drop extended to three straight days, as it printed losses of 0.09% late in the New York session, with the pair exchanging hands near its opening price at around 187.07.
Even though the GBP/JPY is trading with a negative bias, it has failed to extend its losses below the 187.00 figure, which could have exposed the Tenkan-Sen level at 186.55. A breach of the latter would likely resume the ongoing downtrend, with sellers eyeing the Senkou Span A at 185.63, followed by the Kijun-Sen support at 184.71.
Given the fact that a ‘double top’ chart pattern is pending further confirmation, a daily close below the abovementioned Kijun-Sen level would validate the pattern, which is targeting the October 30 swing low of 180.76.
On the other hand, keeping the spot price above the Tenkan-Sen and the 187.00 mark could put into play a test of the year-to-date (YTD) high seen at 188.65.
GBP/JPY Price Analysis – Daily Chart
GBP/JPY Technical Levels
Author

Christian Borjon Valencia
FXStreet
Markets analyst, news editor, and trading instructor with over 14 years of experience across FX, commodities, US equity indices, and global macro markets.


