|

GBP/JPY Price Analysis: Skyrockets and hits a daily high above 186.00

  • GBP/JPY surges to 185.90, gaining more than 150 pips or 0.88%, as US economic data reduces the likelihood of Fed rate hikes.
  • Technical outlook shows the pair broke above the Tenkan-Sen line, targeting the 186.00 level and potentially the YTD high of 186.76.
  • Short-term 4-hour chart indicates upward bias, with the first resistance at 186.00; downside support lies at 185.06, the confluence of the Tenkan-Sen and the top of the Kumo.

The GBP/JPY rallied sharply on Wednesday, gaining more than 150 pips or 0.88%, as market sentiment remains upbeat, following the release of US economic data that could deter the US central bank from hiking rates. The pair is trading at 185.90 after hitting a daily low of 184.31.

GBP/JPY Price Analysis: Technical outlook

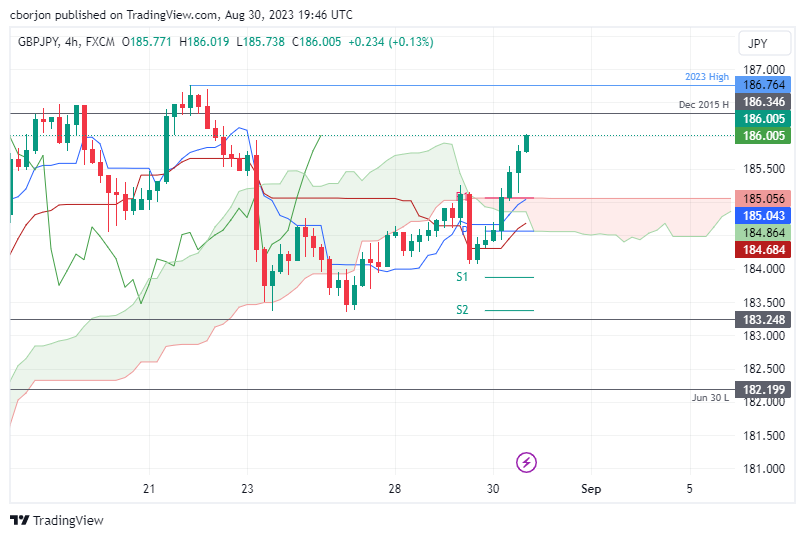
On Wednesday, the GBP/JPY broke above the Tenkan-Sen line, opening the door for further upside, putting into play the 186.00 mark, followed by the year-to-date (YTD) high of 186.76. Conversely, a daily close below 186.00 could exacerbate a re-test of the Tenkan-Sen line at 185.05, followed by the current week’s low of 183.35.

Short-term, the GBP/JPY 4-hour chart portrays the pair as upward biased, and after cracking above the Ichimoku Cloud (Kumo), the cross is extending its gains. First resistance emerges at the 186.00 figure, followed by December’s 2015 high of 186.35, before testing the year-to-date (YTD) high of 186.76.

Contrarily, if GBP/JPY edges lower, the first support would emerge at 185.06, the confluence of the Tenkan-Sen and the top of the Kumo, followed by the Kijun-Sen line at 184.68.

GBP/JPY Price Action – Hourly chart

GBP/JPY

Overview
Today last price186
Today Daily Change1.56
Today Daily Change %0.85
Today daily open184.44
 
Trends
Daily SMA20184
Daily SMA50182.8
Daily SMA100177.22
Daily SMA200169.72
 
Levels
Previous Daily High185.27
Previous Daily Low184.07
Previous Weekly High186.77
Previous Weekly Low183.36
Previous Monthly High184.02
Previous Monthly Low176.32
Daily Fibonacci 38.2%184.53
Daily Fibonacci 61.8%184.81
Daily Pivot Point S1183.92
Daily Pivot Point S2183.4
Daily Pivot Point S3182.72
Daily Pivot Point R1185.12
Daily Pivot Point R2185.79
Daily Pivot Point R3186.31
 

Author

Christian Borjon Valencia

Christian Borjon began his career as a retail trader in 2010, mainly focused on technical analysis and strategies around it. He started as a swing trader, as he used to work in another industry unrelated to the financial markets.

More from Christian Borjon Valencia
Share:

Markets move fast. We move first.

Orange Juice Newsletter brings you expert driven insights - not headlines. Every day on your inbox.

By subscribing you agree to our Terms and conditions.

Editor's Picks

EUR/USD moves sideways below 1.1800 on Christmas Eve

EUR/USD struggles to find direction and trades in a narrow channel below 1.1800 after posting gains for two consecutive days. Bond and stock markets in the US will open at the usual time and close early on Christmas Eve, allowing the trading action to remain subdued. 

GBP/USD keeps range around 1.3500 amid quiet markets

GBP/USD keeps its range trade intact at around 1.3500 on Wednesday. The Pound Sterling holds the upper hand over the US Dollar amid pre-Christmas light trading as traders move to the sidelines heading into the holiday season. 

Gold retreats from record highs, trades below $4,500

Gold retreats after setting a new record-high above $4,520 earlier in the day and trades in a tight range below $4,500 as trading volumes thin out ahead of the Christmas break. The US Dollar selling bias remains unabated on the back of dovish Fed expectations, which continues to act as a tailwind for the bullion amid persistent geopolitical risks.

Bitcoin slips below $87,000 as ETF outflows intensify, whale participation declines

Bitcoin price continues to trade around $86,770 on Wednesday, after failing to break above the $90,000 resistance. US-listed spot ETFs record an outflow of $188.64 million on Tuesday, marking the fourth consecutive day of withdrawals.

Economic outlook 2026-2027 in advanced countries: Solidity test

After a year marked by global economic resilience and ending on a note of optimism, 2026 looks promising and could be a year of solid economic performance. In our baseline scenario, we expect most of the supportive factors at work in 2025 to continue to play a role in 2026.

Avalanche struggles near $12 as Grayscale files updated form for ETF

Avalanche trades close to $12 by press time on Wednesday, extending the nearly 2% drop from the previous day. Grayscale filed an updated form to convert its Avalanche-focused Trust into an ETF with the US Securities and Exchange Commission.