GBP/JPY Price Analysis: Rallies more than 200 pips on Tuesday, above 164.50 despite a risk-off mood


  • GBP/JPY bounced from daily lows below 162.00, advancing sharply and reaching the 165.00 figure.
  • The daily chart portrays the GBP/JPY as upward biased.
  • Short term, the GB/JPY might retest the YTD highs; otherwise, a fall towards 163.00 is on the cards.

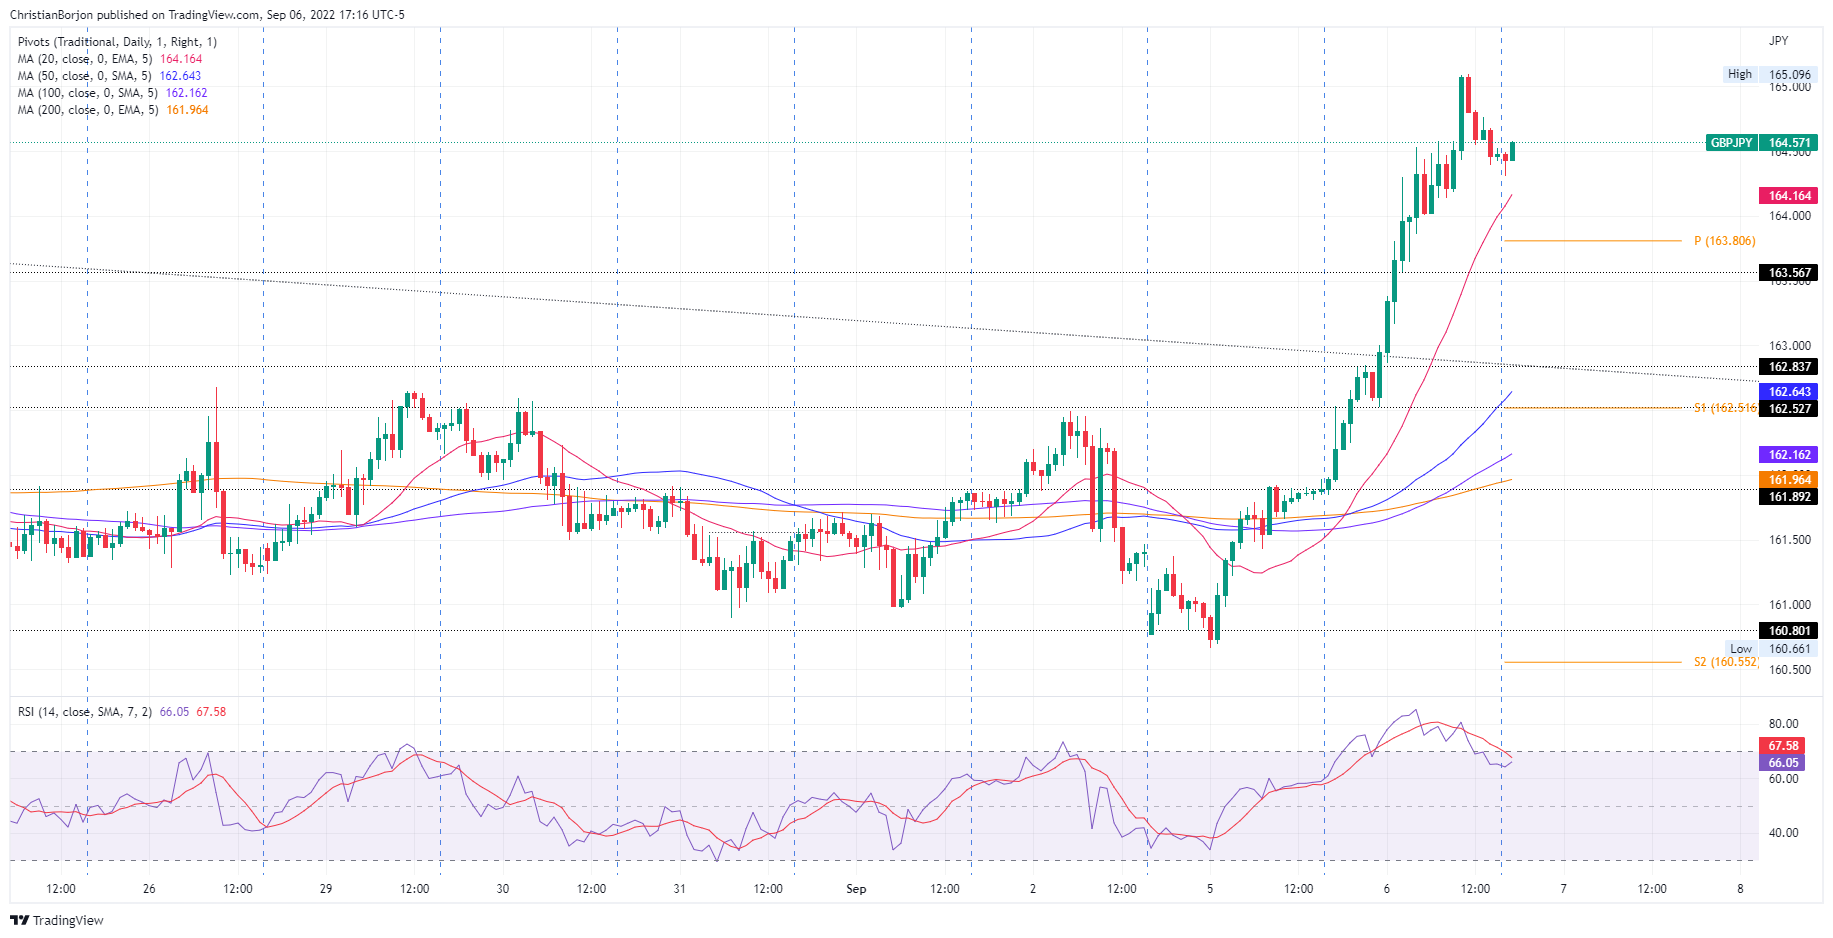
The GBP/JPY breaks above the 162.83 top of a 20-day trading range, rallying sharply more than 250 pips on Tuesday, courtesy of broad Japanese yen weakness across the board, despite a risk-off impulse in the financial markets.

On Tuesday, the GBP/JPY opened near the 20-day EMA, below it at around 161.88, and never looked back, soaring sharply, registering a six-weekly high at around 165.09, in the middle of the New York session. As the Asian Pacific session begins, the GBP/JPY is trading at 164.56, slightly below the opening price.

GBP/JPY Price Analysis: Technical outlook

The GBP/JPY daily chart illustrates the pair breaking above 162.83, top of the 160.80-162.83 range, opening the door for further gains. Worth noting that the Relative Strength Index (RSI) crossed above the 50-midline to the bullish territory. Therefore, the GBP/JPY could test the 166.00 figure in the near term.

Meanwhile, the GBP/JPY one-hour chart depicts the cross-currency pair retracing from daily highs nearby 165.00, eyeing a fall towards the 20-EMA at 164.15. If the GBP/JPY drops below the latter, it will exacerbate a move towards the daily pivot point at 163.80, followed by the 163.00 figure. Otherwise, if the GBP/JPY holds the fort above 164.00, its first resistance would be the 165.00 mark. Once cleared, the next resistance would be the R1 daily pivot at 165.77, followed by the psychological 166.00 price level.


GBP/JPY Key Technical Levels

GBP/JPY

Overview
Today last price 164.56
Today Daily Change 2.52
Today Daily Change % 1.56
Today daily open 161.93
 
Trends
Daily SMA20 161.96
Daily SMA50 163.05
Daily SMA100 162.96
Daily SMA200 159.37
 
Levels
Previous Daily High 162
Previous Daily Low 160.66
Previous Weekly High 162.65
Previous Weekly Low 160.9
Previous Monthly High 163.99
Previous Monthly Low 159.45
Daily Fibonacci 38.2% 161.49
Daily Fibonacci 61.8% 161.18
Daily Pivot Point S1 161.06
Daily Pivot Point S2 160.19
Daily Pivot Point S3 159.72
Daily Pivot Point R1 162.4
Daily Pivot Point R2 162.87
Daily Pivot Point R3 163.74


Share: Feed news

Information on these pages contains forward-looking statements that involve risks and uncertainties. Markets and instruments profiled on this page are for informational purposes only and should not in any way come across as a recommendation to buy or sell in these assets. You should do your own thorough research before making any investment decisions. FXStreet does not in any way guarantee that this information is free from mistakes, errors, or material misstatements. It also does not guarantee that this information is of a timely nature. Investing in Open Markets involves a great deal of risk, including the loss of all or a portion of your investment, as well as emotional distress. All risks, losses and costs associated with investing, including total loss of principal, are your responsibility. The views and opinions expressed in this article are those of the authors and do not necessarily reflect the official policy or position of FXStreet nor its advertisers. The author will not be held responsible for information that is found at the end of links posted on this page.

If not otherwise explicitly mentioned in the body of the article, at the time of writing, the author has no position in any stock mentioned in this article and no business relationship with any company mentioned. The author has not received compensation for writing this article, other than from FXStreet.

FXStreet and the author do not provide personalized recommendations. The author makes no representations as to the accuracy, completeness, or suitability of this information. FXStreet and the author will not be liable for any errors, omissions or any losses, injuries or damages arising from this information and its display or use. Errors and omissions excepted.

The author and FXStreet are not registered investment advisors and nothing in this article is intended to be investment advice.

Recommended content


Recommended content

Editors’ Picks

EUR/USD edges lower toward 1.0700 post-US PCE

EUR/USD edges lower toward 1.0700 post-US PCE

EUR/USD stays under modest bearish pressure but manages to hold above 1.0700 in the American session on Friday. The US Dollar (USD) gathers strength against its rivals after the stronger-than-forecast PCE inflation data, not allowing the pair to gain traction.

EUR/USD News

GBP/USD retreats to 1.2500 on renewed USD strength

GBP/USD retreats to 1.2500 on renewed USD strength

GBP/USD lost its traction and turned negative on the day near 1.2500. Following the stronger-than-expected PCE inflation readings from the US, the USD stays resilient and makes it difficult for the pair to gather recovery momentum.

GBP/USD News

Gold struggles to hold above $2,350 following US inflation

Gold struggles to hold above $2,350 following US inflation

Gold turned south and declined toward $2,340, erasing a large portion of its daily gains, as the USD benefited from PCE inflation data. The benchmark 10-year US yield, however, stays in negative territory and helps XAU/USD limit its losses. 

Gold News

Bitcoin Weekly Forecast: BTC’s next breakout could propel it to $80,000 Premium

Bitcoin Weekly Forecast: BTC’s next breakout could propel it to $80,000

Bitcoin’s recent price consolidation could be nearing its end as technical indicators and on-chain metrics suggest a potential upward breakout. However, this move would not be straightforward and could punish impatient investors. 

Read more

Week ahead – Hawkish risk as Fed and NFP on tap, Eurozone data eyed too

Week ahead – Hawkish risk as Fed and NFP on tap, Eurozone data eyed too

Fed meets on Wednesday as US inflation stays elevated. Will Friday’s jobs report bring relief or more angst for the markets? Eurozone flash GDP and CPI numbers in focus for the Euro.

Read more

Forex MAJORS

Cryptocurrencies

Signatures