|

GBP/JPY Price Analysis: Pound holds steady near 191.00 amid mixed technical landscape

  • GBP/JPY trades near the 191.00 zone with little movement after Monday’s European session.
  • Overall tone is neutral, with short-term signals diverging and long-term resistance capping upside.
  • Support remains just below current levels, while resistance aligns near recent highs.

The GBP/JPY pair showed marginal movement on Monday, holding near the 191.00 zone following the European session. Price action remained flat within a narrow range, reflecting uncertainty in direction as momentum indicators deliver conflicting signals. While intraday buyers provided minor support, broader trend signals remain undecided.

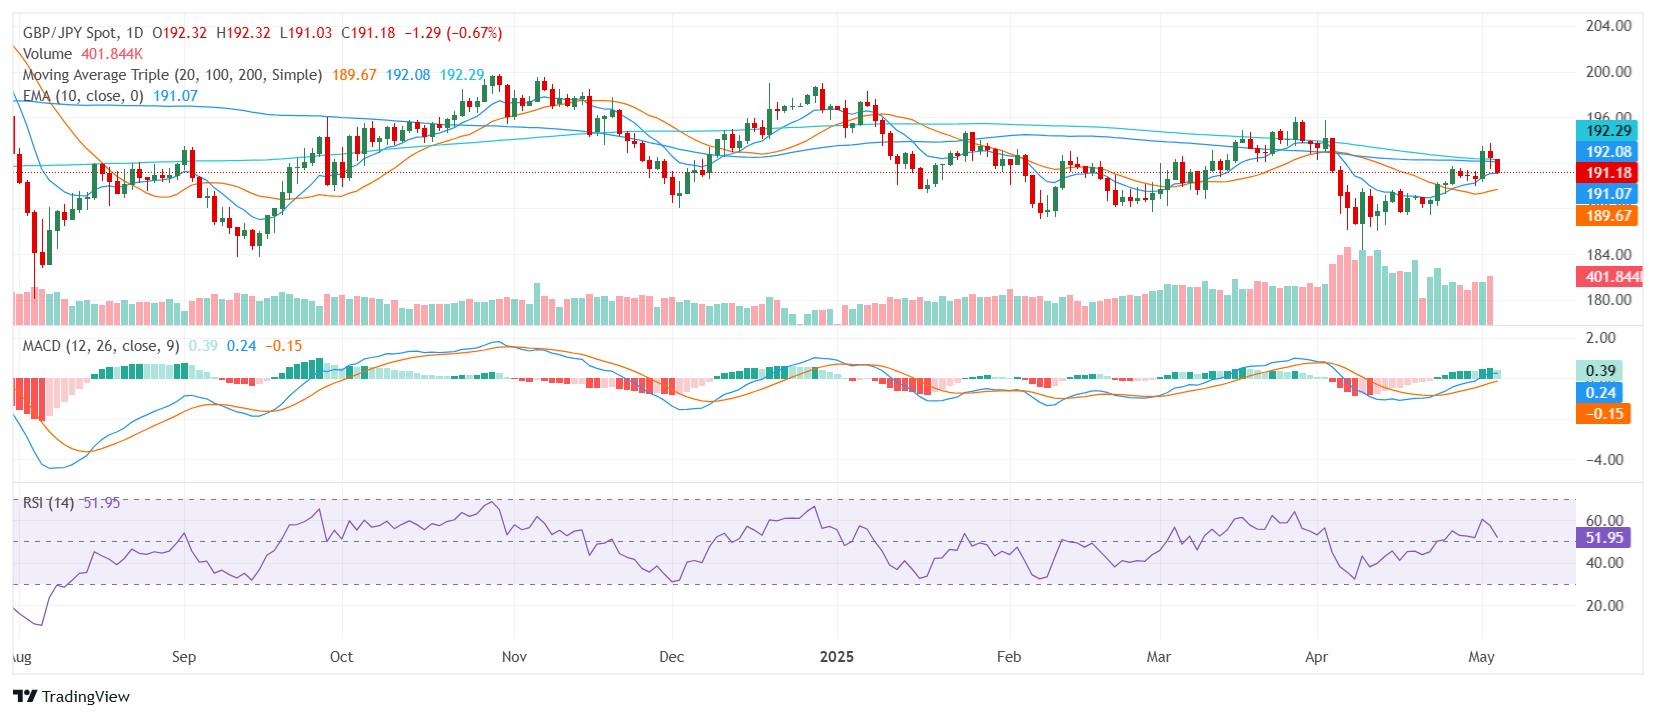
Technically, GBP/JPY is currently exhibiting a neutral outlook. The Relative Strength Index is flat near 52, confirming a lack of directional momentum. The Moving Average Convergence Divergence offers a mild buy signal, but this is countered by a bearish print from the Momentum indicator. The Awesome Oscillator adds to the indecision, staying neutral, while the Ichimoku Base Line also lacks a clear bias.

Trend indicators further illustrate the standoff. The 20-day Simple Moving Average, positioned below price, suggests some bullish undertone in the short term. However, the 100-day and 200-day SMAs — both above current levels — point downward, acting as broader resistance. Until those longer-term levels are breached, any upside may be capped.

Support is found at 191.07, 191.05, and 190.98. Resistance levels lie at 191.17, 191.70, and 191.98. A sustained move outside this tight band may be required to establish a clearer directional breakout in the coming sessions.

Daily Chart

Author

Patricio Martín

Patricio is an economist from Argentina passionate about global finance and understanding the daily movements of the markets.

More from Patricio Martín
Share:

Editor's Picks

AUD/USD eyes 0.7150 barrier nine-day EMA

AUD/USD inches higher after registering modest losses in the previous day, trading around 0.7130 during the Asian hours. The technical analysis of the daily chart indicates that the pair is moving sideways within the rectangle pattern, suggesting a consolidation as neither the bulls nor the bears have enough momentum to take control of the market.

USD/JPY trades below 160.00 intervention threshold; bullish bias intact

The USD/JPY pair attracts some sellers during the Asian session amid fears that authorities will step in again to prop up the Japanese Yen. Furthermore, the Israel-Lebanon truce prompts some profit-taking around the US Dollar and exerts downward pressure on the currency pair.

Gold puts its 200-day SMA to the test near $4,420

Gold keeps the bullish stance in place in the latter part of Thursday’s session, although a convincing break above the key $4,500 mark per troy ounce still remains elusive. The precious metal’s advance comes amid the resurgence of some selling interest around the Greenback, improving risk sentiment, and declining US Treasury yields across the board.

Bitcoin’s massive storm is back: Why the sell-off is far from over

Bitcoin price action over the last few weeks has felt less like a normal, healthy correction and more like a slow grinding crash that continues to wreak havoc on holdings and trading accounts. And everything suggests that the dramatic crash isn’t over.

Nonfarm payrolls: Testing the limits of Fed policy patience

The upcoming nonfarm payrolls report for May will provide the final update on the US labor market before Kevin Warsh attends his first policy meeting as the new Fed Chair later this month.

Recession on paper: What really moves the Canadian Loonie now?

Statistics Canada handed the headline writers a gift and the analysts a headache. Real GDP shrank 0.1% on an annualized basis in the first quarter, and with the fourth quarter of 2025 revised down to a 1.0% contraction, that is two negative quarters in a row, the textbook definition of a technical recession and Canada's first since the pandemic.