|

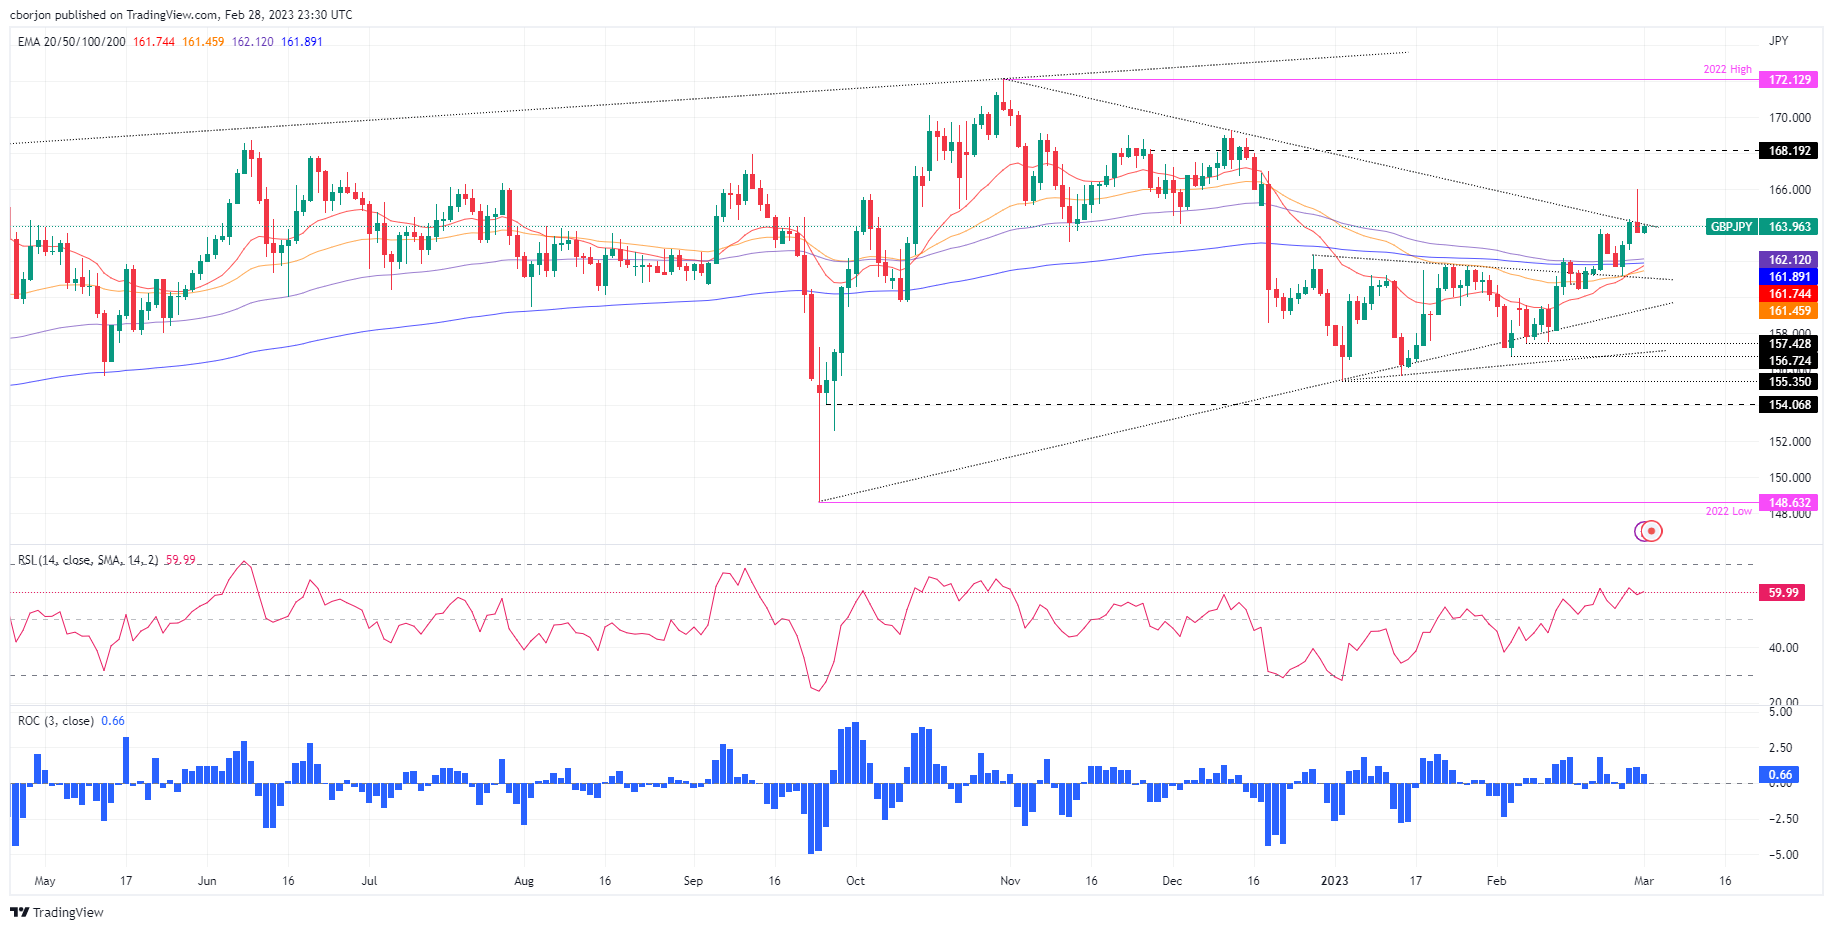
GBP/JPY Price Analysis: Plunges 200 pips from around 166.00, back below 164.00

  • GBP/JPY formed an inverted hammer, meaning sellers are in charge.
  • The GBP/JPY would face strong support at the confluence of the 100/200/20-day EMAs.
  • GBP/JPY Price Analysis: In the near term, it’s neutral to upward biased.

The GBP/JPY registers a minimal upside as Wednesday’s Asian session begins. On Tuesday, the GBP/JPY printed losses of 0.35% and formed an inverted hammer, meaning that further downside is expected. At the time of typing, the GBP/JPY exchanges hands at 163.90 after hitting a YTD high on Tuesday of 166.00.

GBP/JPY Price Action

After hitting a new year-to-date high, the GBP/JPY retraced more than 200 pips and achieved a daily close below 163.60. Traders should be aware that the cross-currency pair pierced a four-month-old downslope trendline, but buyers unable to commit to its longs and sellers stepping in around 166.00 dragged the exchange rates lower.

The Relative Strength Index (RSI), albeit in bullish territory, is almost flat, while the Rate of Change (RoC) suggests that buying pressure is waning. Therefore, further downside is expected.

Hence, the GBP/JPY first support would be the February 28 daily low of 163.58, which, once cleared, would exacerbate a fall toward the weekly low of 162.59. A breach of the latter would send the GBP/JPY toward the confluence of the 100 and the 20-day Exponential Moving Averages (EMAs) at around 161.89/74, respectively.

As an alternate scenario, the GBP/JPY first resistance would be 164.00. Once the GBP/JPY hurdles that level, and the 165.00 figure would be the next to be challenged by Pound Sterling (GBP) buyers, ahead of the YTD high at 166.00.

GBP/JPY Daily chart

GBP/JPY Key technical levels

GBP/JPY

Overview
Today last price163.88
Today Daily Change-0.41
Today Daily Change %-0.25
Today daily open164.29
 
Trends
Daily SMA20160.6
Daily SMA50160.05
Daily SMA100163.6
Daily SMA200163.36
 
Levels
Previous Daily High164.31
Previous Daily Low162.61
Previous Weekly High163.76
Previous Weekly Low161.17
Previous Monthly High161.85
Previous Monthly Low155.36
Daily Fibonacci 38.2%163.66
Daily Fibonacci 61.8%163.26
Daily Pivot Point S1163.16
Daily Pivot Point S2162.04
Daily Pivot Point S3161.46
Daily Pivot Point R1164.87
Daily Pivot Point R2165.44
Daily Pivot Point R3166.57

Author

Christian Borjon Valencia

Markets analyst, news editor, and trading instructor with over 14 years of experience across FX, commodities, US equity indices, and global macro markets.

More from Christian Borjon Valencia
Share:

Editor's Picks

AUD/USD advances modestly, hovers around 0.7050

AUD/USD reverses part of Friday’s sharp decline and gyrates around the 0.7050 region ahead of the opening bell in Asia. The pair’s modest recovery comes amid humble losses in the Greenback, always amid the steady uncertainty on the geopolitical front. Moving forward, Westpac’s Consumer Confidence measure will be the salient release on Tuesday.

USD/JPY holds higher ground toward 160.50 despite 'Yentervention' fears

USD/JPY holds higher ground toward 160.50 in Monday's Asian trading, despite intervention fears. Japan’s revised GDP print, which confirmed that the economy lost momentum in the first quarter, weighs on the Japanese Yen. Meanwhile, Friday's upbeat US NFP report and fresh Israel-Iran attacks favor the US Dollar bulls, underpinning the currency pair.

Gold faces initial resistance near  $4,350

Gold manages to reclaim the $4,300 mark per troy ounce and above on Monday. The yellow metal’s small uptick comes on the back of modest losses in the US Dollar, while traders continue to follow geopolitical events in the Middle East and the likelihood of a tighter-for-longer Fed.

Why institutions prefer Solana over newer rivals for stablecoin adoption – Solstice CEO
The cryptocurrency industry has entered a new era spearheaded by stablecoins, real-world asset (RWA) tokenization, decentralized finance (DeFi), and Artificial Intelligence (AI) applications.
$1.75 trillion: Is SpaceX the most popular IPO in history, or the most engineered?

On June 12, the largest initial public offering (IPO) in history is set to hit the tape, and almost nobody is asking whether the price is right, because almost everybody already wants in.

The US economy defies the rules: 100 days into the Oil shock and the recession signal is still missing

More than three months after the start of the Iran war and the resulting disruption to global energy markets, the US economy continues to display remarkable resilience. The conflict has triggered a sharp rise in Oil prices, reignited inflationary pressures and fueled widespread concerns about a potential economic slowdown.