|

GBP/JPY Price Analysis: Oscillates around 162.00 on risk-off impulse

  • GBP/JPY remains positive in the week, up by 0.32%, despite falling in the last couple of days.
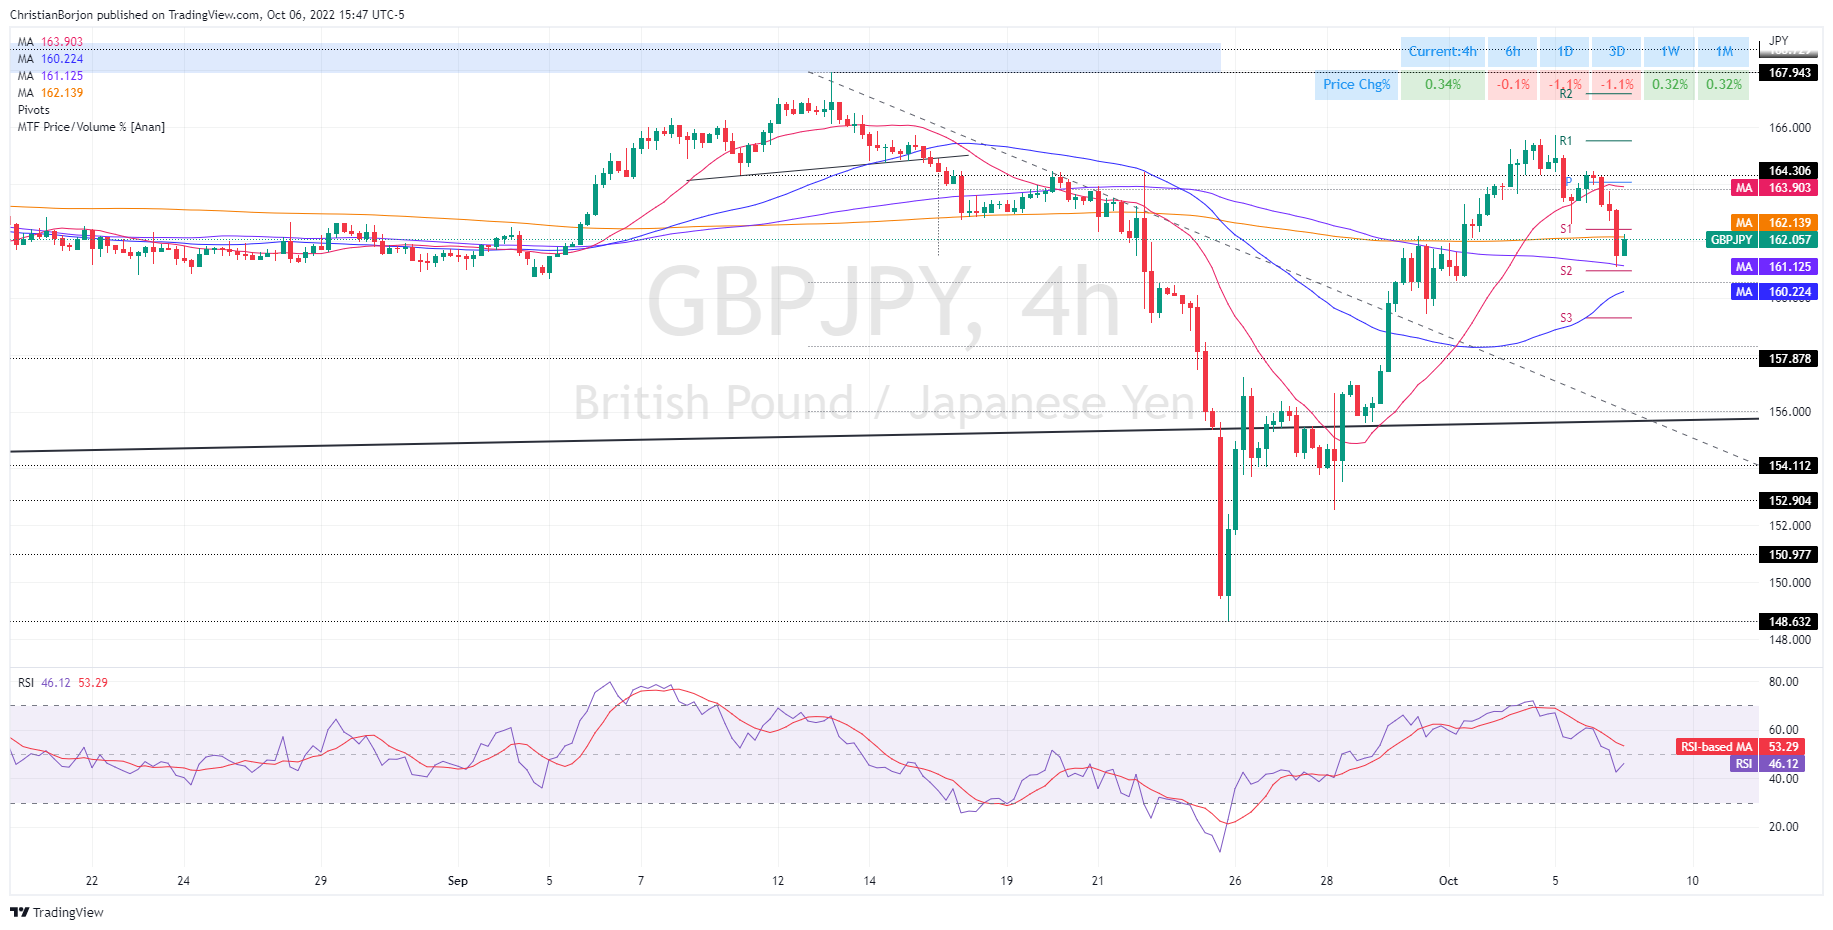
  • The cross-currency failure to crack the 200-EMA in the 4-hour chart will exacerbate a fall toward 160.00.

The GBP/JPY extended its losses amid worries that a Fed dovish pivot should be put on a drawer, with US economic data giving mixed signals ahead of a crucial US employment report on Friday. Therefore, sentiment shifted sour as US equities finished with substantial losses. At the time of writing, the GBP/JPY is trading at 162.05, testing the confluence of several DMAs.

GBP/JPY Price Forecast

From a daily chart perspective, the GBP/JPY is testing a busy area, with the 20 and 50-day EMAs hoovering around the 162.05-18 region. Notably, the GBP/JPY tumbled below the 100-day EMA, exacerbating a fall toward the daily low of 161.08. Nevertheless, buyers stepping in around the 161.00 figure trimmed some of Thursday’s losses, trying to achieve a daily close above important DMAs.

Near-term, the GBP/JPY four-hour chart portrays the pair as neutral-to-downward biased due to the cross falling below the 20 and the 200-EMAs. At the time of typing, the GBP/JPY is testing the 200-EMA at 162.13, which, once cleared, could open the door for a rally toward the 20-EMA at 163.90.

Nevertheless, the path of least resistance is downwards, so failure to crack the 200-EMA will expose essential support levels. Therefore, the GBP/JPY first support will be the 142.00 mark. A breach of the latter will expose the confluence of the S2 and the 100-EMA at 161.12, followed by the 50-EMA at 160.22.

GBP/JPY Additional Technical Levels

GBP/JPY

Overview
Today last price162.06
Today Daily Change-1.69
Today Daily Change %-1.03
Today daily open163.75
 
Trends
Daily SMA20162.24
Daily SMA50162.27
Daily SMA100163.09
Daily SMA200160.6
 
Levels
Previous Daily High165.72
Previous Daily Low162.61
Previous Weekly High162.18
Previous Weekly Low148.8
Previous Monthly High167.22
Previous Monthly Low148.8
Daily Fibonacci 38.2%163.8
Daily Fibonacci 61.8%164.53
Daily Pivot Point S1162.33
Daily Pivot Point S2160.91
Daily Pivot Point S3159.22
Daily Pivot Point R1165.45
Daily Pivot Point R2167.14
Daily Pivot Point R3168.56

Author

Christian Borjon Valencia

Christian Borjon began his career as a retail trader in 2010, mainly focused on technical analysis and strategies around it. He started as a swing trader, as he used to work in another industry unrelated to the financial markets.

More from Christian Borjon Valencia
Share:

Markets move fast. We move first.

Orange Juice Newsletter brings you expert driven insights - not headlines. Every day on your inbox.

By subscribing you agree to our Terms and conditions.

Editor's Picks

EUR/USD remains below 1.1750 ahead of ECB policy decision

EUR/USD remains on the back foot below 1.1750 in the European session on Thursday. Traders move to the sidelines and refrain from placing any fresh directional bets on the pair ahead of the ECB policy announcements and the US CPI inflation data. 

GBP/USD ticks north following BoE’s announcement

The Bank of England decided to cut the benchmark interest rate by 25 basis points as expected. The MPC voting was tight, with just 5 out of 9 officials backing the decision. Sterling Pound advances on relief as investors anticipated a more dovish outcome.

Gold holds losses below $4,350 ahead of US CPI report

Gold struggles to capitalize on the previous day's move higher and holds its pullback below $4,350 in the European session on Thursday. The downtick could be attributed to some profit-taking amid a US Dollar bounce. All eyes now remain on the US CPI inflation data. 

US CPI set to grow at stable 3.1% in November, further complicating the Fed’s dilemma

The US Consumer Price Index is forecast to rise 3.1% YoY in November, a mild uptick compared with September. The inflation report will not include monthly CPI figures.

Bitcoin steadies near $87,000 as strong ETF inflows offset bearish pressure

Bitcoin price hovers around $87,000 on Thursday, stabilizing after declining earlier this week. US-listed spot ETFs recorded $457.29 million in inflows on Wednesday, the highest single-day inflows since November 11.

Dogecoin Price Forecast: DOGE breaks key support amid declining investor confidence

Dogecoin (DOGE) trades in the red on Thursday, following a 4% decline on the previous day. The DOGE supply in profit declines as large wallet investors trim their portfolios. Derivatives data shows a surge in bearish positions amid declining retail interest.