|

GBP/JPY Price Analysis: Holds steady around 191.00 amid thin liquidity conditions

  • GBP/JPY hovers around 191.00, with trading subdued due to the Easter holiday.
  • Technical indicators show potential for movement, with key levels at 191.57 and 190.74, marking immediate targets.
  • Future direction hinges on breaking 192.00 resistance or 190.00 support.

On Friday, the GBP/JPY remained steady at around 191.00, almost flat, as the financial markets remained closed in observance of the Easter holiday. In the meantime, Fed Chair Jerome Powell crossed the newswires, saying that monetary policy is well placed to react to a range of different data paths.

GBP/JPY Price Analysis: Technical outlook

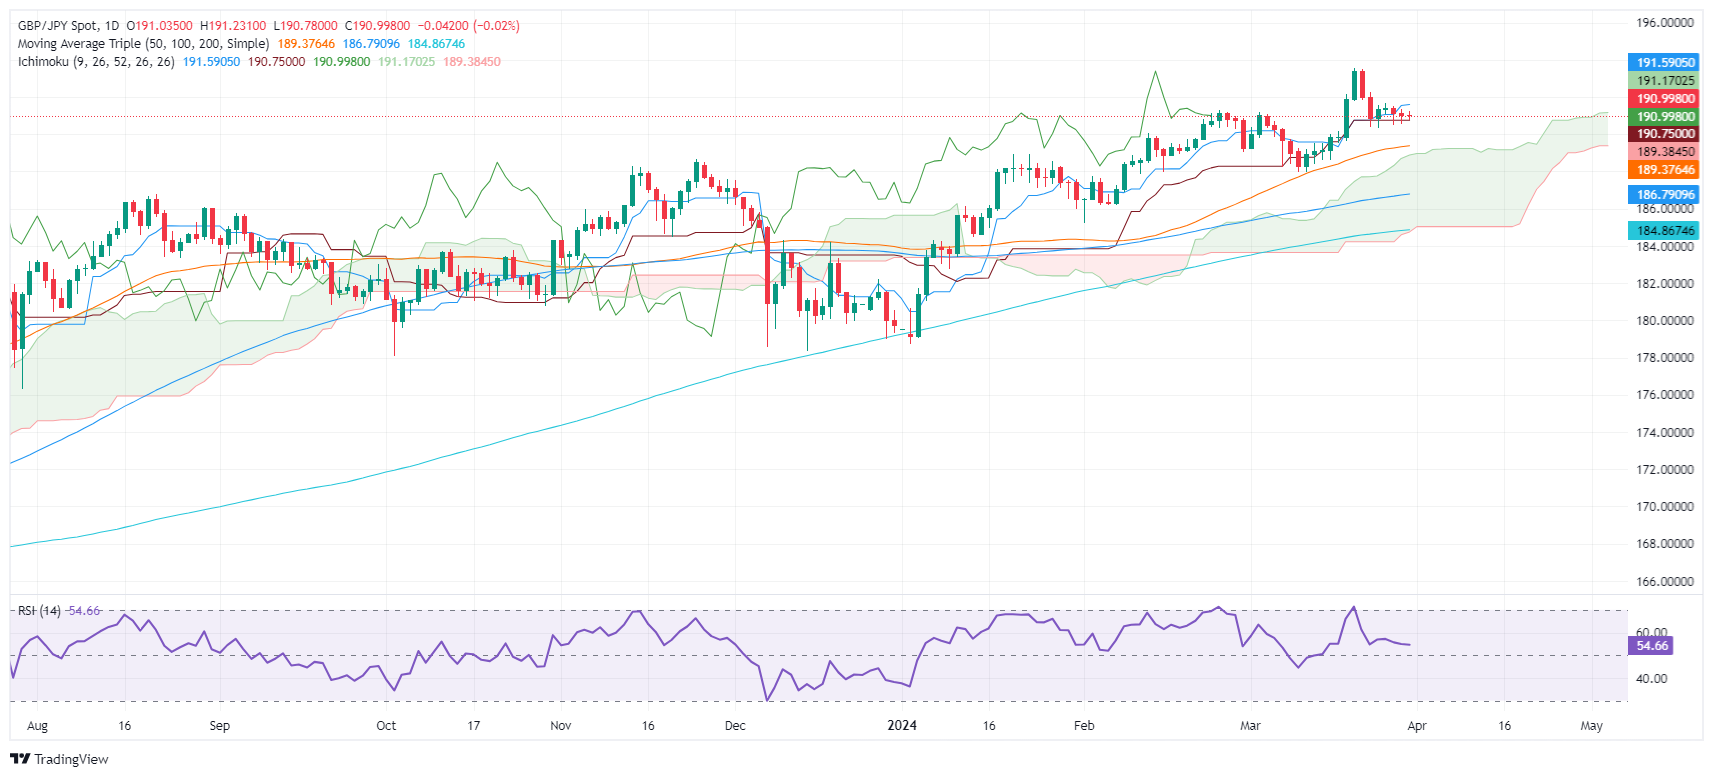
The daily chart suggests the GBP/JPY is trading sideways, capped on the upside by the Tenkan-Sen at 191.57. Since the pair fell below the latter, the exchange rate has remained beneath the 191.40 area, which has opened the door for further downside.

A push below 191.00 could pave the way for a deeper pullback. The next support would be the Kijun Sen at 190.74, followed by the March 25 wing low of 190.33. A breach of the latter would expose the next support level at 190.00.

On the other hand, if GBP/JPY stays afloat and rallies above the Tenkan-Sen, that would open the door to challenge 192.00. Further gains are seen above that level, with the 193.00 mark, followed by the current year-to-date (YTD) high of 193.53.

GBP/JPY Price Action – Daily Chart
GBP/JPY

Overview
Today last price191.08
Today Daily Change0.04
Today Daily Change %0.02
Today daily open191.04
 
Trends
Daily SMA20190.43
Daily SMA50189.32
Daily SMA100186.73
Daily SMA200184.83
 
Levels
Previous Daily High191.33
Previous Daily Low190.57
Previous Weekly High193.54
Previous Weekly Low189.54
Previous Monthly High191.33
Previous Monthly Low185.23
Daily Fibonacci 38.2%190.86
Daily Fibonacci 61.8%191.04
Daily Pivot Point S1190.63
Daily Pivot Point S2190.22
Daily Pivot Point S3189.87
Daily Pivot Point R1191.39
Daily Pivot Point R2191.74
Daily Pivot Point R3192.15

Author

Christian Borjon Valencia

Markets analyst, news editor, and trading instructor with over 14 years of experience across FX, commodities, US equity indices, and global macro markets.


More from Christian Borjon Valencia
Share:

Editor's Picks

AUD/USD renews two-month lows near 0.6950 after Australian CPI data

AUD/USD is renewing two-month lows near 0.6950 in the Asian session on Wednesday, as below-expectations August Australian underlying CPI data pours cold water on expectations for further RBA interest rate hikes. Chinese PMI data also fail to inspire the Australian Dollar, despite a pause in the US Dollar advance.

USD/JPY drops below 157.00 as intervention risks counter Japan's weak data

USD/JPY keeps losses below 157.00 in the Asian session on Wednesday, as hawkish BoJ expectations, along with intervention risks, underpin the Japanese Yen, countering dismal domestic factory output and retail sales data. Meanwhile, a broad US Dollar retreat also collaborates to the pair's downside.

Gold consolidates below $4,200, looks to US ADP and PCE

Gold struggles to capitalize on the previous day's recovery from an eight-week low, consolidating below $4,200 in the Asian session on Wednesday. The overnight slide in oil prices eased the US Treasury bond rout, supporting the bullion. However, Fed rate-hike bets and inflationary concerns keep bond yields near multi-year highs. Moreover, geopolitical uncertainties underpin the safe-haven US Dollar, which, in turn, limits bullion.

Ethereum sees profit-taking near $2,700 ahead of key US economic data
Ethereum (ETH) has shown signs of profit-taking near $2,700 over the past few days, with rising exchange deposits and a slowdown in exchange-traded fund (ETF) inflows ahead of US inflation and labor market data releases. The top altcoin's Exchange Reserves, which track the total amount of a crypto asset held across exchange wallets, have increased by roughly 125K ETH since Friday.
Silver is more volatile than Gold ahead of PCE and NFP. This chart shows the positioning gap
The market’s attention is focused on American data this week, but there’s something only those with a trained eye may be looking at: Gold and Silver positioning gap. Financial markets are moving on fears, mostly related to persistently high energy prices driven by the Middle East war. Sure, the US Dollar (USD) is strong, but at what cost?
Silver is more volatile than Gold ahead of PCE and NFP. This chart shows the positioning gap
The market’s attention is focused on American data this week, but there’s something only those with a trained eye may be looking at: Gold and Silver positioning gap. Financial markets are moving on fears, mostly related to persistently high energy prices driven by the Middle East war. Sure, the US Dollar (USD) is strong, but at what cost?