|

GBP/JPY Price Analysis: GBP in command, investors may start taking profits

  • The daily RSI on the GBP/JPY reveals a strong bullish posture, while the MACD shows a shift towards a more balanced market.
  • The hourly chart discloses the RSI regularly exceeding overbought thresholds.

In Wednesday's session, the GBP/JPY is trading at the 191.65 level, showing a 0.57% uptick. The market sentiment for GBP/JPY is majorly bullish, but there is a high likelihood that investors may start taking profits as the cross reached overbought conditions on the hourly chart.

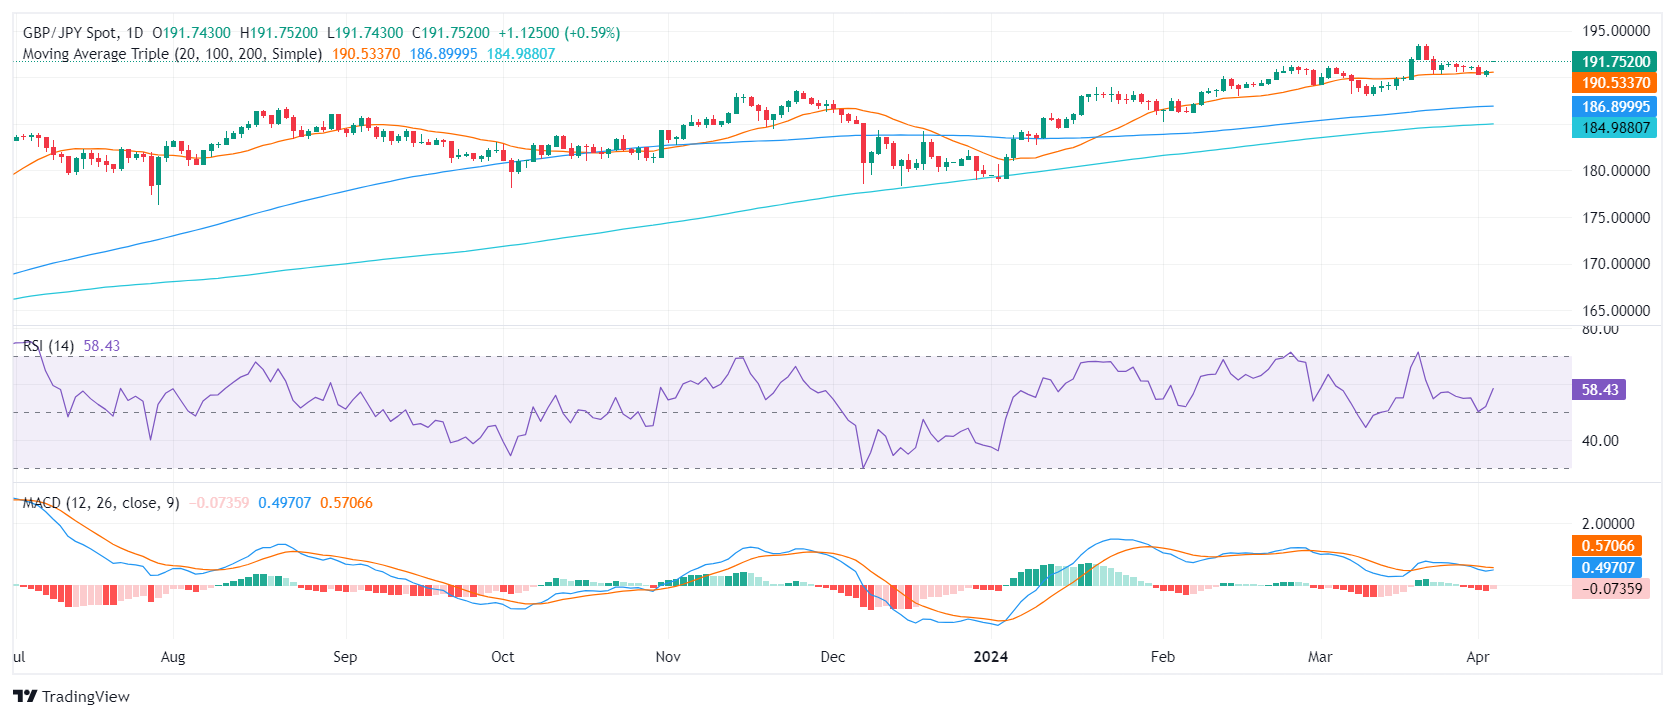
On the daily chart, the Relative Strength Index (RSI) pointing north above 50 indicates that buyers currently have a slight advantage in the market. While there are no extreme levels, suggesting overbought conditions, the RSI reveals a generally strong bullish posture. On the contrary, the Moving Average Convergence Divergence (MACD) is generating decreasing red bars, hinting at the presence of negative momentum and pointing toward more balanced market conditions.

GBP/JPY daily Chart

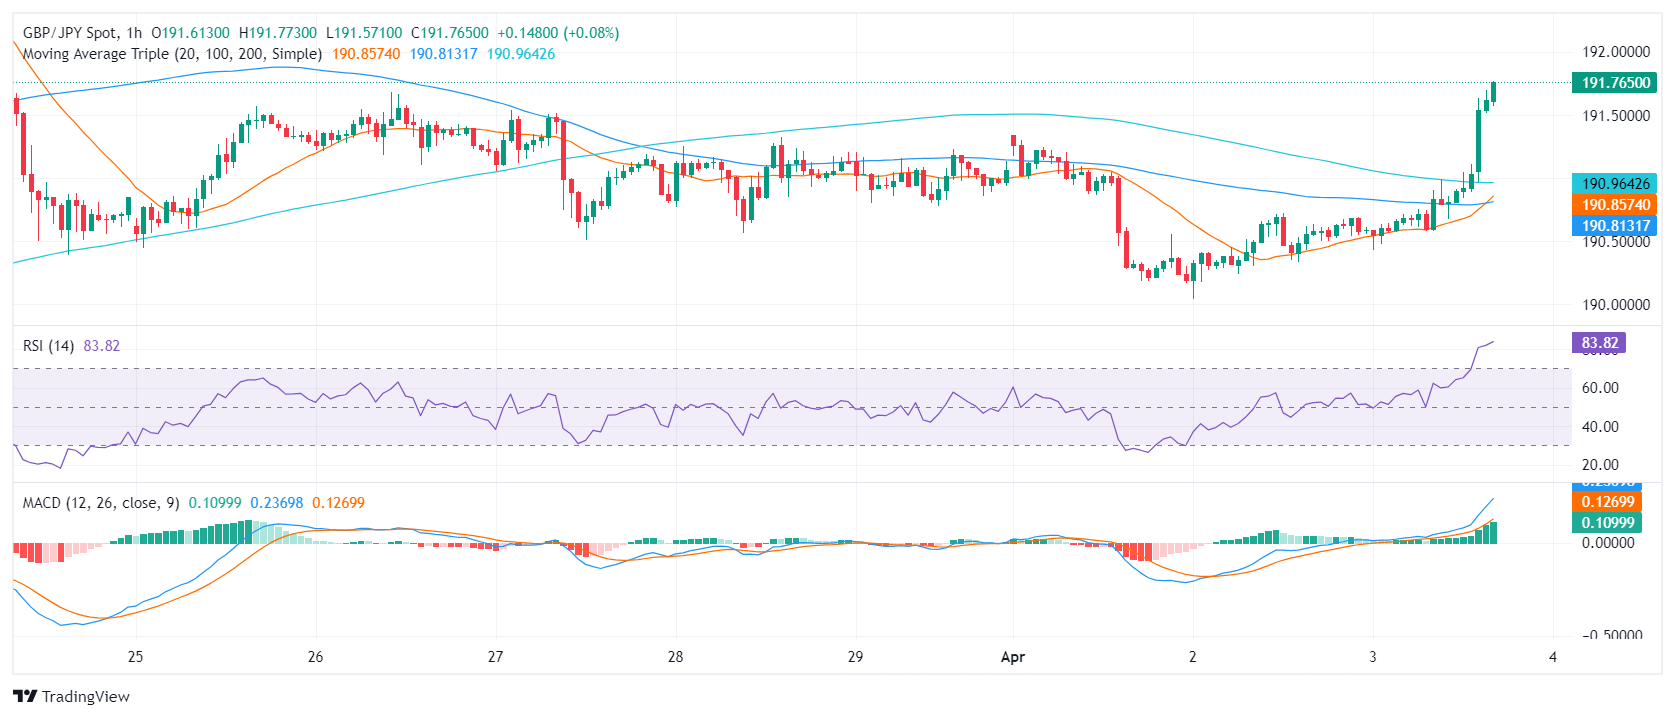
The hourly chart presents a contrasting perspective with the RSI logging higher values, lying deep in overbought terrain. This tends to predict a downward correction as the upward momentum may be overextended. In addition, the green rising bars of the MACD histogram also demonstrate positive momentum, reinforcing the strong presence of buyers in the market.

GBP/JPY hourly Chart

In terms of the overall trend, the GBP/JPY is positioned above its 20-day, 100-day, and 200-day SMAs. This pattern signals an enduring bullish trend in both short-term and long-term periods. In summary, while both the daily and hourly charts appear mostly bullish, the indicators reveal a stronger upward momentum in the hourly market with the possibility of a downward correction in the short term. However, as the pair holds above the main SMAs, the downward movements could be considered a mere correction.

GBP/JPY

Overview
Today last price191.84
Today Daily Change1.21
Today Daily Change %0.63
Today daily open190.63
 
Trends
Daily SMA20190.46
Daily SMA50189.47
Daily SMA100186.86
Daily SMA200184.94
 
Levels
Previous Daily High190.72
Previous Daily Low190.04
Previous Weekly High191.68
Previous Weekly Low190.35
Previous Monthly High193.54
Previous Monthly Low187.96
Daily Fibonacci 38.2%190.46
Daily Fibonacci 61.8%190.3
Daily Pivot Point S1190.21
Daily Pivot Point S2189.79
Daily Pivot Point S3189.53
Daily Pivot Point R1190.88
Daily Pivot Point R2191.14
Daily Pivot Point R3191.56

Author

Patricio Martín

Patricio is an economist from Argentina passionate about global finance and understanding the daily movements of the markets.

More from Patricio Martín
Share:

Markets move fast. We move first.

Orange Juice Newsletter brings you expert driven insights - not headlines. Every day on your inbox.

By subscribing you agree to our Terms and conditions.

Editor's Picks

EUR/USD moves sideways below 1.1800 on Christmas Eve

EUR/USD struggles to find direction and trades in a narrow channel below 1.1800 after posting gains for two consecutive days. Bond and stock markets in the US will open at the usual time and close early on Christmas Eve, allowing the trading action to remain subdued. 

GBP/USD keeps range around 1.3500 amid quiet markets

GBP/USD keeps its range trade intact at around 1.3500 on Wednesday. The Pound Sterling holds the upper hand over the US Dollar amid pre-Christmas light trading as traders move to the sidelines heading into the holiday season. 

Gold retreats from record highs, trades below $4,500

Gold retreats after setting a new record-high above $4,520 earlier in the day and trades in a tight range below $4,500 as trading volumes thin out ahead of the Christmas break. The US Dollar selling bias remains unabated on the back of dovish Fed expectations, which continues to act as a tailwind for the bullion amid persistent geopolitical risks.

Bitcoin slips below $87,000 as ETF outflows intensify, whale participation declines

Bitcoin price continues to trade around $86,770 on Wednesday, after failing to break above the $90,000 resistance. US-listed spot ETFs record an outflow of $188.64 million on Tuesday, marking the fourth consecutive day of withdrawals.

Economic outlook 2026-2027 in advanced countries: Solidity test

After a year marked by global economic resilience and ending on a note of optimism, 2026 looks promising and could be a year of solid economic performance. In our baseline scenario, we expect most of the supportive factors at work in 2025 to continue to play a role in 2026.

Avalanche struggles near $12 as Grayscale files updated form for ETF

Avalanche trades close to $12 by press time on Wednesday, extending the nearly 2% drop from the previous day. Grayscale filed an updated form to convert its Avalanche-focused Trust into an ETF with the US Securities and Exchange Commission.