GBP/JPY Price Analysis: Falls below 191.00 toward descending channel’s lower boundary
- GBP/JPY tests the lower boundary of the descending channel at 190.80 level.
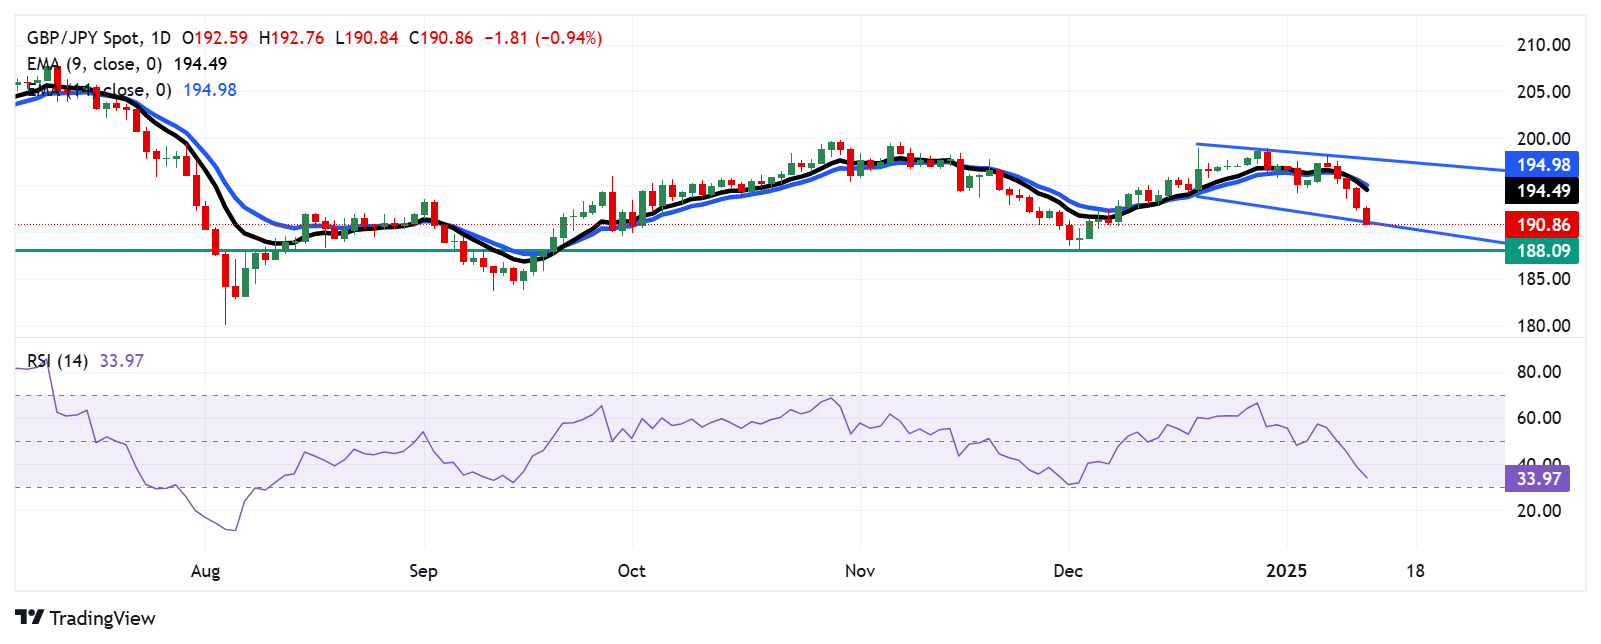
- The 14-day RSI declines toward the 30 level, reinforcing the persistent bearish bias.
- The nine-day EMA at 194.52 appears as the primary resistance.

The GBP/JPY cross extends its losing streak for the fifth consecutive day, trading around 191.00 during the early European hours on Monday. An analysis of the daily chart indicates that the price movement within the descending channel pattern is intensifying, which points to a strengthening bearish bias.
The 14-day Relative Strength Index (RSI), a key momentum indicator, holds falls toward the 30 level, reinforcing the ongoing bearish momentum. Moreover, the GBP/JPY cross trades below both the nine-day and 14-day Exponential Moving Averages (EMAs), further suggesting weaker short-term price momentum.
On the downside, the GBP/JPY cross tests the lower boundary of the descending channel at 190.80 level. A break below this pattern would reinforce the bearish bias and put pressure on the currency cross to approach its four-month low at 188.09, which was recorded on December 3, 2024.
The GBP/JPY cross could find primary resistance at the nine-day EMA at 194.52, followed by the 14-day EMA at 194.99 level. A break above the latter, which is aligned with the psychological level of 195.00, would improve the short-term price momentum and support the pair to approach the descending channel’s upper boundary at the 198.00 level.
GBP/JPY: Daily Chart
(The story was corrected on January 24 at 04:30 GMT to say, in the title, that the GBP/JPY falls below 191.00 toward the descending channel’s lower boundary, not the ascending channel.)
British Pound PRICE Today
The table below shows the percentage change of British Pound (GBP) against listed major currencies today. British Pound was the weakest against the Japanese Yen.
| USD | EUR | GBP | JPY | CAD | AUD | NZD | CHF | |
|---|---|---|---|---|---|---|---|---|
| USD | 0.30% | 0.62% | -0.28% | 0.09% | 0.08% | 0.15% | 0.01% | |
| EUR | -0.30% | 0.29% | -0.55% | -0.15% | -0.08% | -0.09% | -0.21% | |
| GBP | -0.62% | -0.29% | -0.84% | -0.44% | -0.38% | -0.39% | -0.49% | |
| JPY | 0.28% | 0.55% | 0.84% | 0.39% | 0.31% | 0.32% | 0.33% | |
| CAD | -0.09% | 0.15% | 0.44% | -0.39% | -0.05% | 0.05% | 0.00% | |
| AUD | -0.08% | 0.08% | 0.38% | -0.31% | 0.05% | -0.05% | -0.11% | |
| NZD | -0.15% | 0.09% | 0.39% | -0.32% | -0.05% | 0.05% | -0.11% | |
| CHF | -0.01% | 0.21% | 0.49% | -0.33% | -0.01% | 0.11% | 0.11% |
The heat map shows percentage changes of major currencies against each other. The base currency is picked from the left column, while the quote currency is picked from the top row. For example, if you pick the British Pound from the left column and move along the horizontal line to the US Dollar, the percentage change displayed in the box will represent GBP (base)/USD (quote).
Author

Akhtar Faruqui
FXStreet
Akhtar Faruqui is a Forex Analyst based in New Delhi, India. With a keen eye for market trends and a passion for dissecting complex financial dynamics, he is dedicated to delivering accurate and insightful Forex news and analysis.


