|

GBP/JPY Price Analysis: Faces rejection at critical hurdle amid overbought conditions

  • GBP/JPY stalls the advance, as 151.50 beckons.
  • Key hurdle on the 4H chart caps the rally in the spot.
  • Overbought RSI conditions also triggered the retreat. 

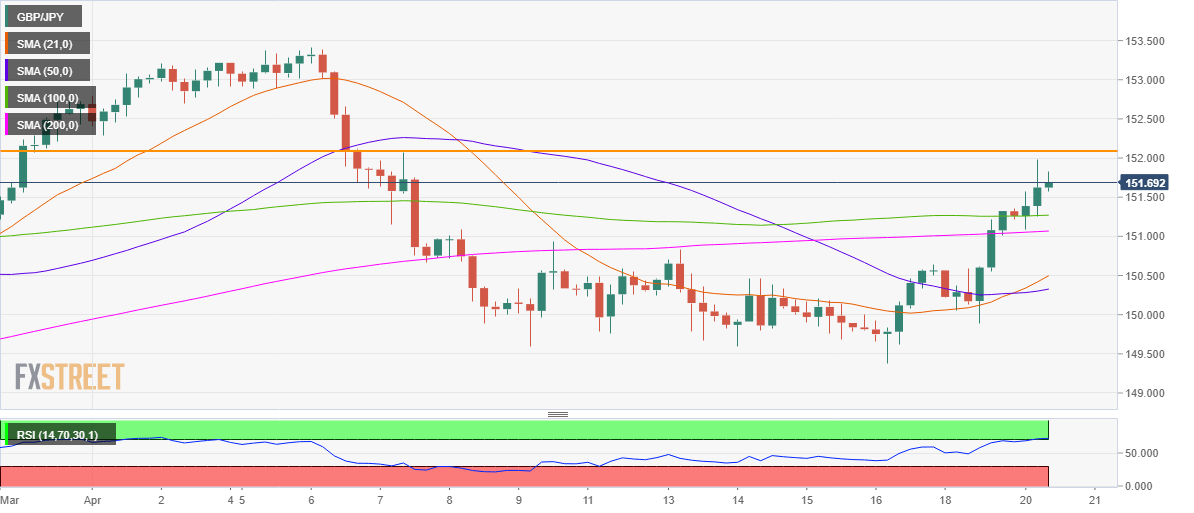
GBP/JPY is retreating from two-week highs of 152.03, looking to test the 151.50 support area amid a sharp pullback in GBP/USD from above the 1.4000 mark.

The downside in the cross remains by the solid gains in the USD/JPY, as the major continues to benefit from rising US Treasury yields.

Technically, GBP/JPY turned south after facing stiff resistance near the critical horizontal (orange) trendline at 152.08.

The overbought Relative Strength Index (RSI) conditions on the four-hour chart justified the retracement from higher levels.

Although a bull cross seen on the said time frame earlier on, suggests that the uptrend could resume after the pullback. The 21-simple moving average (SMA) pierced through the 50-SMA from below, which represented a bullish crossover.

To the upside, the bulls look to retest the abovementioned powerful hurdle, above which doors would open towards 152.50 levels.

On the flip side, the bears target the 100-SMA at 151.27 if the retreat extends. Further south, the 200-SMA at 151.08 could emerge as strong support.

GBP/JPY four-hour chart
GBP/JPY additional levels to watch

GBP/JPY

Overview
Today last price151.65
Today Daily Change0.36
Today Daily Change %0.24
Today daily open151.32
 
Trends
Daily SMA20150.97
Daily SMA50149.78
Daily SMA100145.35
Daily SMA200141.37
 
Levels
Previous Daily High151.35
Previous Daily Low149.89
Previous Weekly High150.83
Previous Weekly Low149.38
Previous Monthly High152.79
Previous Monthly Low148.12
Daily Fibonacci 38.2%150.79
Daily Fibonacci 61.8%150.45
Daily Pivot Point S1150.36
Daily Pivot Point S2149.39
Daily Pivot Point S3148.9
Daily Pivot Point R1151.82
Daily Pivot Point R2152.32
Daily Pivot Point R3153.28

Author

Dhwani Mehta

Dhwani Mehta

FXStreet

Residing in Mumbai (India), Dhwani is a Senior Analyst and Manager of the Asian session at FXStreet. She has over 10 years of experience in analyzing and covering the global financial markets, with specialization in Forex and commodities markets.


More from Dhwani Mehta
Share:

Editor's Picks

AUD/USD: Next upside target comes at 0.7000

AUD/USD has advanced further, clinching its third consecutive day of gains and trading at shouting distance from the key 0.7000 threshold on Tuesday. The widespread improved sentiment in the risk complex helped the Aussie maintain its upside momentum, while the fresh selling impulse in the Greenback also contributed to the move.

USD/JPY rises back above 158.00 despite hawkish BoJ outlook

USD/JPY rises back above 158.00 in the early European morning on Tuesday. The pair strengthens as the Japanese Yen fails to find any inspiration from hawkish BoJ expectations and looming intervention risks. Meanwhile, geopolitical uncertainty and elevated US bond yields keep the US Dollar near its YTD high despite receding October Fed hike bets. This, in turn, helps the pair stay supported.

Gold stays firm; looks at $4,200

Gold builds on Monday’s marginal bounce, although it struggles to reclaim the key $4,200 mark per troy ounce so far on Tuesday. The yellow metal’s advance comes on the back of the fresh downside momentum in the US Dollar in tandem with retreating US Treasury yields across the curve.

Ethena Price Forecast: ENA corrects as Ether.Fi launches stablecoin on the protocol
Ethena (ENA) trades near $0.24000 on Tuesday amid growing technical weakness. The Ethereum Layer-2 token has shed some of its recent gains, which peaked at $0.2946 on September 27, reinforcing profit-taking and buyer exhaustion. An extended sell-off would bring ENA to test the psychological support at $0.2000 and key technical levels further down.
Japanese Yen nears 158.00: Two analysts agree it's bullish, and disagree on how far the breakout goes

The JPY is drifting near 158.00 against the USD ahead of a busy week of Japanese data and a still-unclear BoJ timetable. The two most recent FXStreet analyses agree on the direction, but they disagree on the target and the mechanism.

Eurozone inflation just hit 3.8%, its highest in three years. This chart shows why the ECB can’t simply hike its way out

The ECB would normally have a relatively straightforward answer to inflation running almost twice its target: raise interest rates. But these are not normal circumstances. This time, the bond market is already doing part of the tightening for it, leaving the ECB facing an increasingly difficult dilemma.















