|

GBP/JPY Price Analysis: Dwindles at the 20-DMA drops to the 163.00 figure

  • The GBP/JPY daily chart portrays the pair as neutral-to-downwards, pierce of 163.00, to send the pair towards the 163.10s area.
  • From a short-term perspective, the GBP/JPY is range bound, but the higher-time frame could lean the pair neutral-to-downwards.

The GBP/JPS is almost flat as Tuesday’s Asian Pacific session begins, seesawing around the 100-day EMA after hitting the weekly high at 163.84 on Monday. At the time of writing, the GBP/JPY is trading at 163.06, amid a risk-off mood as shown by Asian futures preparing to open lower.

GBP/JPY Price Analysis: Technical outlook

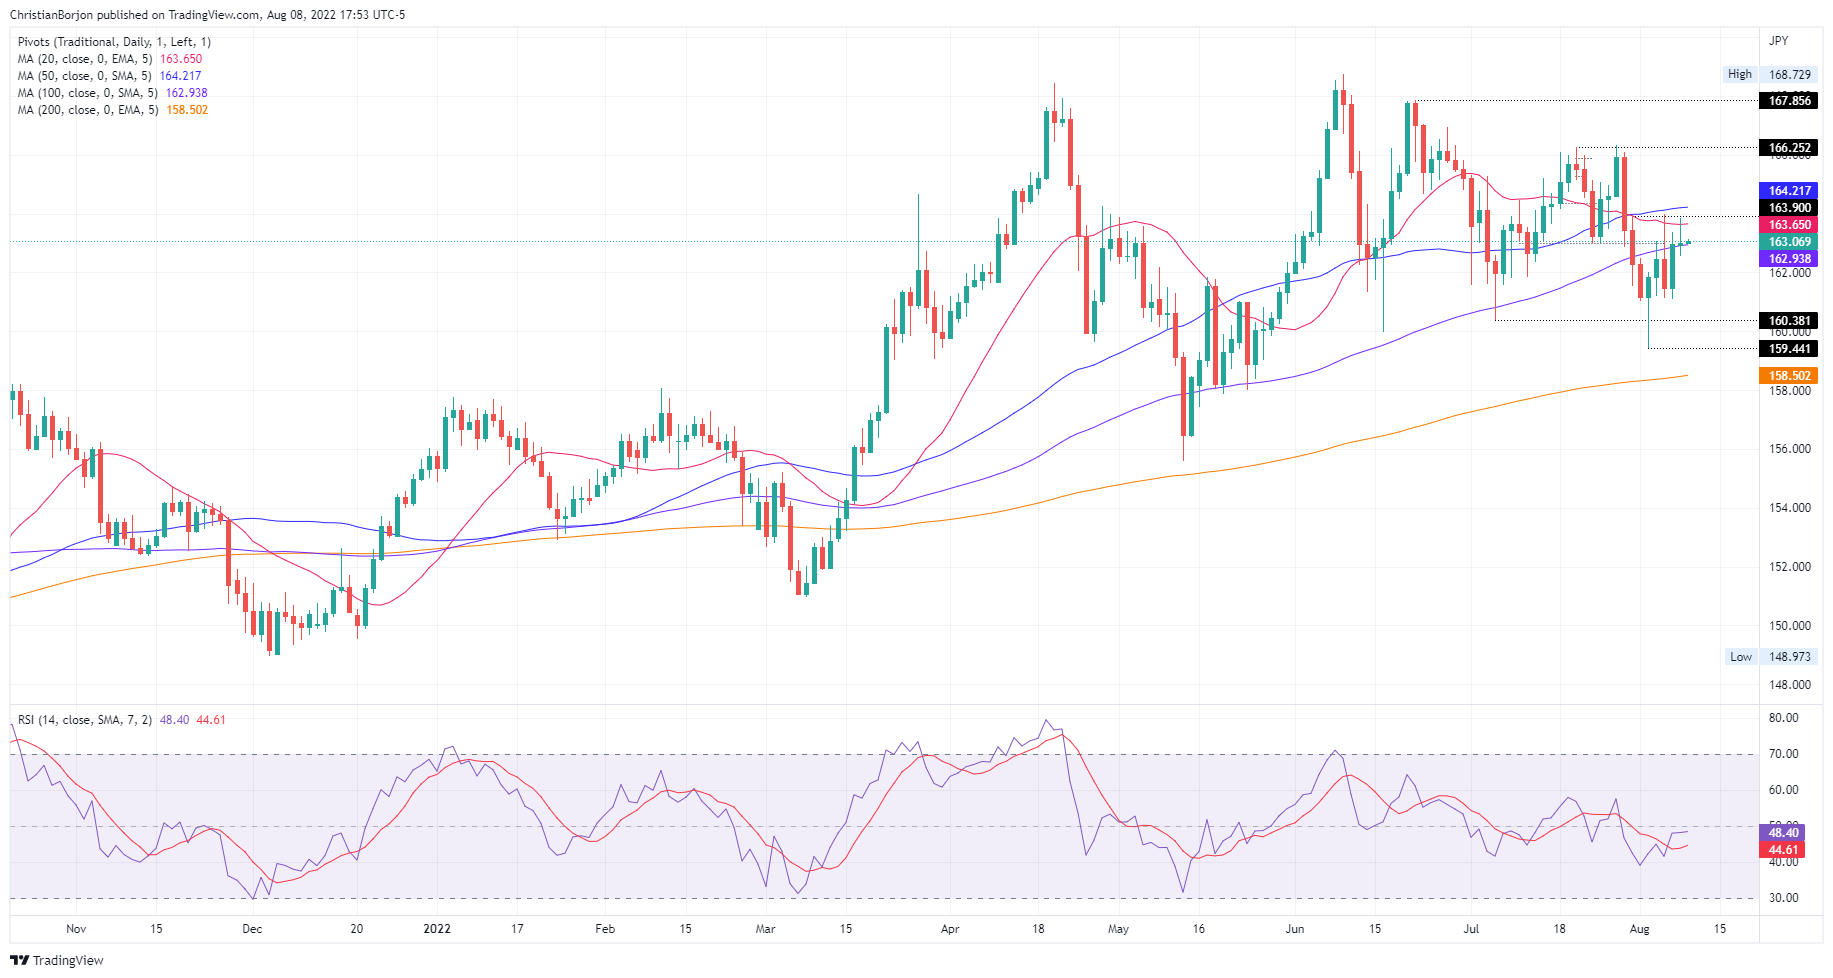
The GBP/JPY daily chart shows the pound remains heavy, albeit finishing Monday’s session with gains. Nevertheless, buyers’ inability to breach the 20-day EMA at 136.64 opened the door for sellers, who stepped in, sending the cross-currency diving towards the 163.00 figure. All that said, the pair is neutral-to-bearish biased.

Therefore, the GBP/JPY’s first support would be the August 8 low at 162.56. Break below will expose the August 5 low at 161.11, followed by the August 2 swing low at 159.44. Otherwise, if buyers reclaim the 20-day EMA at 163.64, that would open the door for a test of the 50-day EMA at 164.21.

GBP/JPY Daily chart

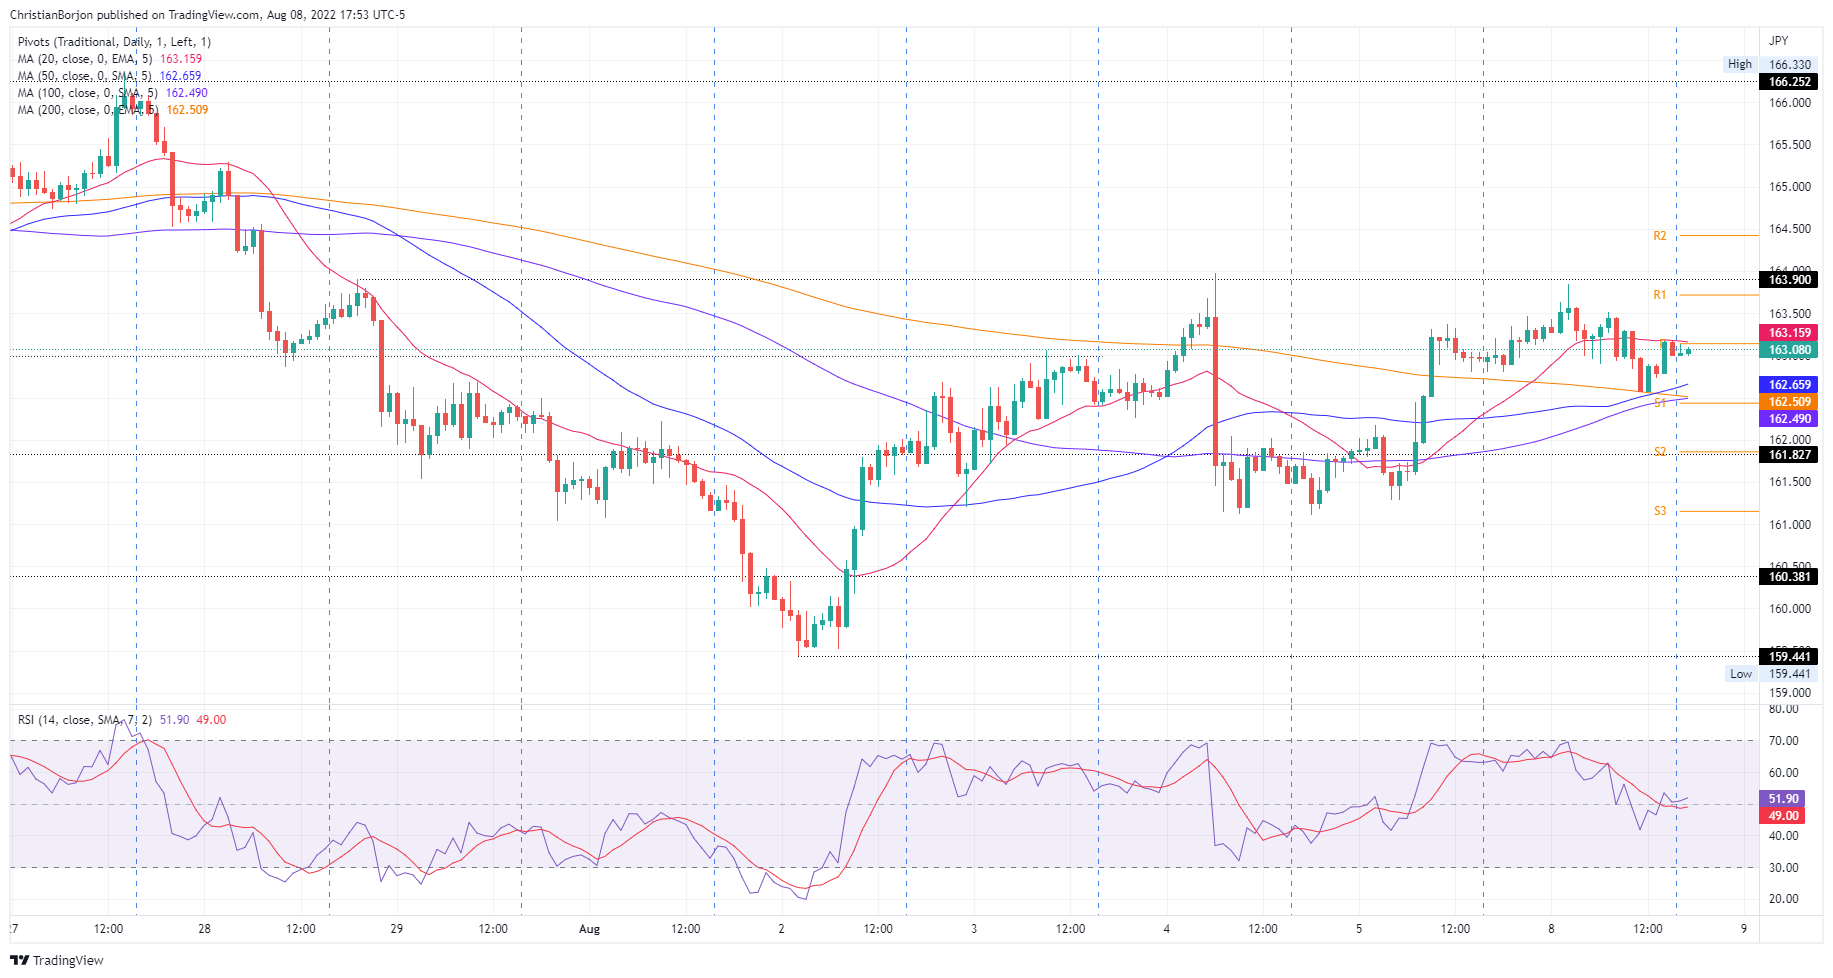
The cross-currency pair is neutral biased from a short-term perspective, capped by the August 5 low and the August 8 high, at 161.11-163.84, respectively. Additionally, the Relative Strength Index (RSI), is almost flat, just above the 50-midline, but directionless. Therefore, a break above 163.84 could send the pair towards the August 4 high at 163.97, which, once cleared, could open the door for further gains. On the flip side, the GBP/JPY first support would be a busy support area, with the intersection of the 50, 200, and 100-hour EMAs around the 162.49-162.65. Once cleared, the next support would be the S2 pivot point at 161.86, followed by the S3 daily pivot at 161.16.

GBP/JPY Hourly chart

GBP/JPY Key Technical Levels

GBP/JPY

Overview
Today last price163.06
Today Daily Change-0.07
Today Daily Change %-0.04
Today daily open163.13
 
Trends
Daily SMA20163.7
Daily SMA50164.24
Daily SMA100162.92
Daily SMA200158.48
 
Levels
Previous Daily High163.33
Previous Daily Low161.12
Previous Weekly High163.99
Previous Weekly Low159.45
Previous Monthly High166.34
Previous Monthly Low160.4
Daily Fibonacci 38.2%162.49
Daily Fibonacci 61.8%161.97
Daily Pivot Point S1161.73
Daily Pivot Point S2160.32
Daily Pivot Point S3159.52
Daily Pivot Point R1163.93
Daily Pivot Point R2164.73
Daily Pivot Point R3166.13

Author

Christian Borjon Valencia

Markets analyst, news editor, and trading instructor with over 14 years of experience across FX, commodities, US equity indices, and global macro markets.

More from Christian Borjon Valencia
Share:

Editor's Picks

EUR/USD slumps below 1.1750 as USD benefits from risk-aversion

EUR/USD comes under renewed bearish pressure in the European session and trades below 1.1750 following a recovery attempt earlier in the day. The US Dollar gathers strength and weighs on the pair as investors seek refuge in the wake of Israel and the United States' joint attack on Iran.

GBP/USD targets 1.3500 barrier near moving averages

GBP/USD rebounds from the daily losses, trading around 1.3450 during the Asian hours on Monday. The technical analysis of the daily chart indicates an ongoing bearish bias, as the pair trades within a descending channel pattern.

Gold surges on safe-haven demand, rises above $5,400

Gold benefits from intense risk-aversion on Monday and climbs above $5,400, setting a fresh monthly-high in the process. Tensions in the Middle East remain high as Israel and Hezbollah continue to exchange strikes following the US-Israel joint attack on Iran over the weekend.

Bitcoin, Ethereum and Ripple under pressure as key supports face breakdown risk

Bitcoin, Ethereum, and Ripple prices trade on the back foot at the start of this week on Monday, after extending losses in the previous week. BTC is on the brink of a breakdown, ETH is capped below key resistance, and XRP risks a crack of the trendline.

The market is paying for insurance, not apocalypse

As expected, this morning felt less like a Monday market open and more like a fire drill. Futures screens flickered red. S&P contracts down almost 1%. Nasdaq off 1.2%. Brent leaped 13% through $80. Gold rose 1.6% toward $5350 before paring some gains. The dollar is strutting mildly. The Swiss franc is quietly doing what it always does in a storm, catching some safe-haven flows.

Pi Network Price Forecast: Core team offloads supply, weighing on PI recovery

Pi Network  hovers below $0.1700, broadly steady at press time on Monday, attempting a recovery after a 2% loss the previous day. Sunday’s decline aligned with nearly 49 million PI tokens offloaded by the Pi Foundation, implying a spike in supply pressure that capped the prevailing four-day recovery.