|

GBP/JPY Price Analysis: Buyers reclaimed 192.00 as morning star forms

  • GBP/JPY climbs past 192.00, buoyed by light economic data and upbeat sentiment.
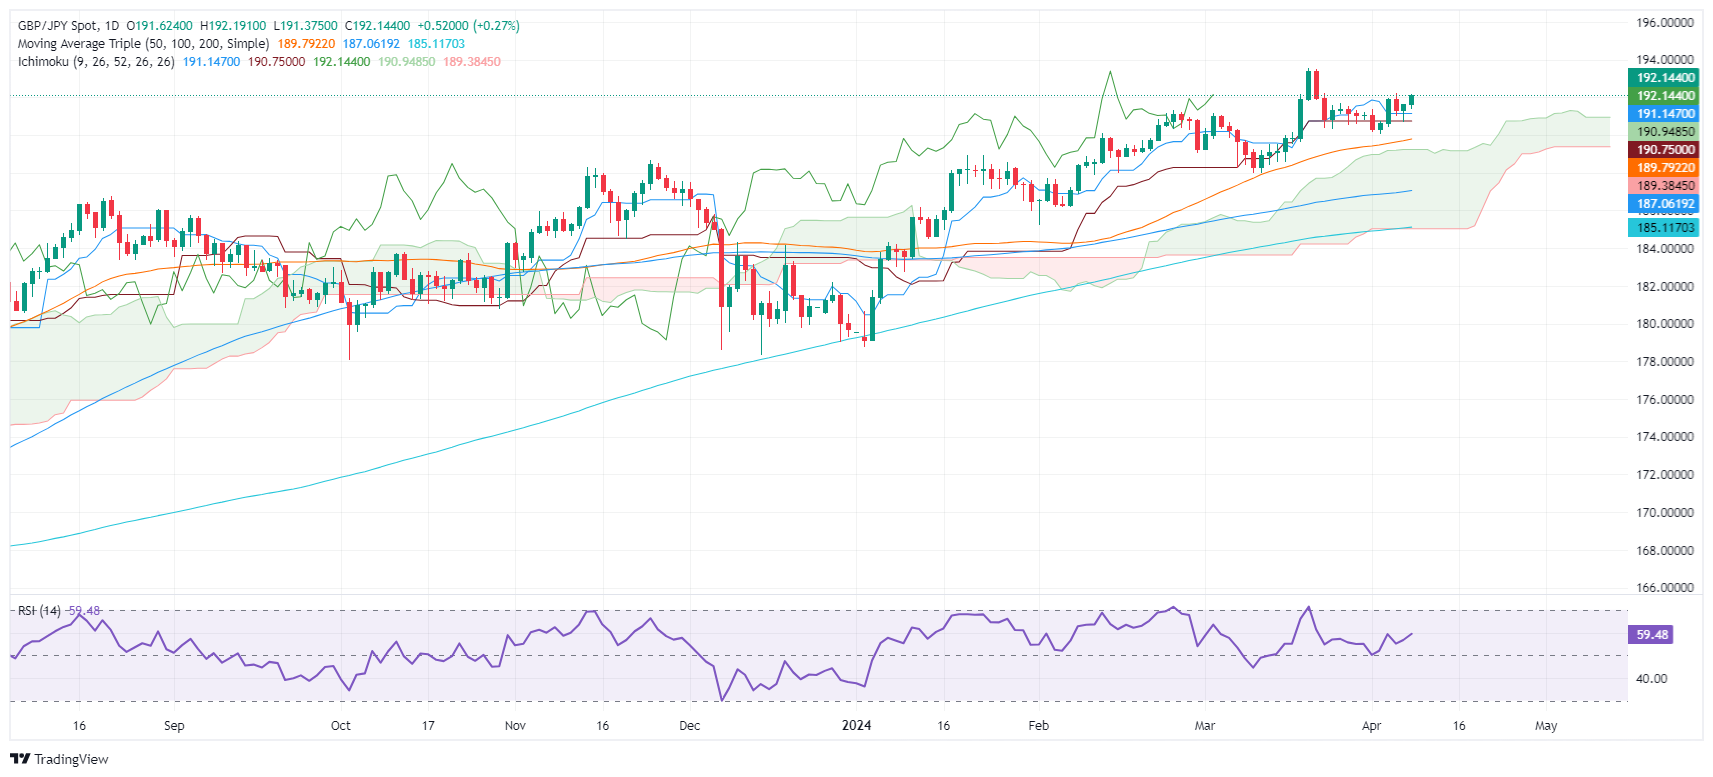
  • Resistance at 192.24, 192.50, with eyes on 193.00+.
  • Defined support levels mark potential reversal points if retreat occurs.

The GBP/JPY climbed 0.29% late in the North American session after bouncing off daily lows reached earlier at around 191.35. Risk appetite improvement amid a light economic docket sponsored a rally in the cross-pair, which trades at 192.10.

GBP/JPY Price Analysis: Technical outlook

The GBP/JPY daily chart suggests the air is neutral to slightly upwards after buyers reclaimed 192.00. If the pair surpasses the April 4 high of 192.24, look for a test of 192.50. A breach of the latter will open the door to challenging the 193.00 figure. Further upside is seen at 193.53.

 On the other hand, if the cross dives below 192.00, that would expose the Tenkan-Sen level at 191.14. Once surpassed, the next support would be the Senkou Span A at 190.94, ahead of the Kijun-Sen at 190.74. in further weakness, the next stop would be the April 2 low of 190.03.

GBP/JPY Price Action – Daily Chart

GBP/JPY

Overview
Today last price192.1
Today Daily Change0.48
Today Daily Change %0.25
Today daily open191.62
 
Trends
Daily SMA20190.76
Daily SMA50189.7
Daily SMA100187
Daily SMA200185.07
 
Levels
Previous Daily High191.64
Previous Daily Low190.68
Previous Weekly High192.25
Previous Weekly Low190.04
Previous Monthly High193.54
Previous Monthly Low187.96
Daily Fibonacci 38.2%191.27
Daily Fibonacci 61.8%191.05
Daily Pivot Point S1190.99
Daily Pivot Point S2190.35
Daily Pivot Point S3190.03
Daily Pivot Point R1191.95
Daily Pivot Point R2192.28
Daily Pivot Point R3192.91

Author

Christian Borjon Valencia

Christian Borjon began his career as a retail trader in 2010, mainly focused on technical analysis and strategies around it. He started as a swing trader, as he used to work in another industry unrelated to the financial markets.

More from Christian Borjon Valencia
Share:

Markets move fast. We move first.

Orange Juice Newsletter brings you expert driven insights - not headlines. Every day on your inbox.

By subscribing you agree to our Terms and conditions.

Editor's Picks

EUR/USD falls toward 1.1700 on broad USD recovery

EUR/USD turns south and declines toward 1.1700 on Wednesday. The US Dollar gathers recovery momentum and forces the pair to stay on the back foor, as traders look to USD short-covering ahead of US inflation report on Thursday. However, the downside could be capped by hawkish ECB expectations. 

GBP/USD trades deep in red below 1.3350 after soft UK inflation data

GBP/USD stays under strong selling pressure midweek and trades below 1.3350. The UK annual headline and core CPI rose by 3.2% each, missing estimates of 3.5% and 3.4%, respectively, reaffirming dovish BoE expectations and smashing the Pound Sterling across the board ahead of Thurday's BoE policy announcements. 

Gold clings to moderate daily gains above $4,300

Following Tuesday's volatile action, Gold regains its traction on Wednesday and trades in positive territory above $4,300. While the buildup in the USD recovery momentum caps XAU/USD's upside, the cautious market stance helps the pair hold its ground.

Bitcoin risks deeper correction as ETF outflows mount, derivative traders stay on the sidelines

Bitcoin (BTC) remains under pressure, trading below $87,000 on Wednesday, nearing a key support level. A decisive daily close below this zone could open the door to a deeper correction.

Monetary policy: Three central banks, three decisions, the same caution

While the Fed eased its monetary policy on 10 December for the third consecutive FOMC meeting, without making any guarantees about future action, the BoE, the ECB and the BoJ are holding their respective meetings this week. 

AAVE slips below $186 as bearish signals outweigh the SEC investigation closure

Aave (AAVE) price continues its decline, trading below $186 at the time of writing on Wednesday after a rejection at the key resistance zone. Derivatives positioning and momentum indicators suggest that bearish forces still dominate in the near term.