|

GBP/JPY Price Analysis: Buyers prepare an assault for a resistance trendline ahead of 165.00

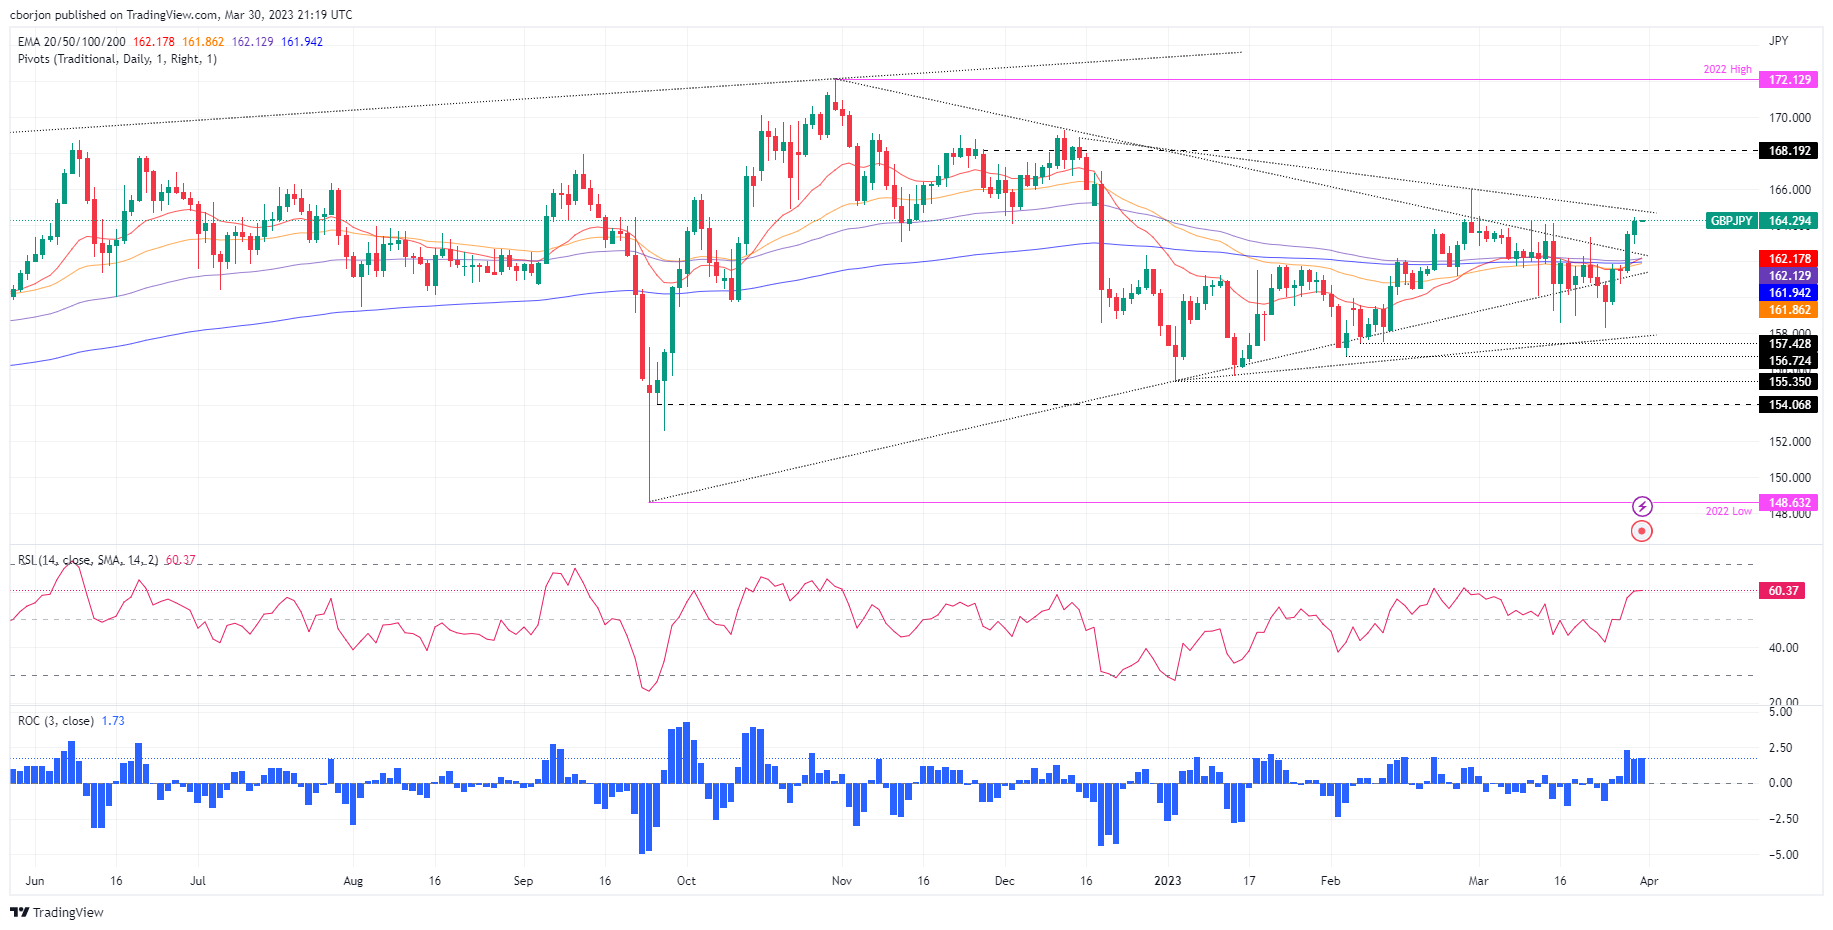
  • The GBP/JPY daily chart tests a three-month-old resistance trendline at around 164.70-90.
  • The Relative Strength Index (RSI) and the Rate of Change (RoC) shifted bullish, indicating an upward trend for GBP/JPY.
  • GBP/JPY Price Analysis: Downside risks remain below 164.00.

The GBP/JPY pair is gaining 0.53% on Thursday and is trading at 164.29 after hitting a daily low of 162.96. The pair's uptrend is attributed to the market's current risk-on sentiment and expectations that central banks will pause hiking rates after the recent banking turmoil in the US and Switzerland.

GBP/JPY Price action

The GBP/JPY daily chart suggests the pair is testing a three-month-old resistance trendline that passes at around 164.70-90, trading at 4-week highs. The Relative Strength Index (RSI) shifted bullish, suggesting the GBP/JPY outlook is upwards. The Rate of Change (RoC) jumped from a neutral stance after the GBP/JPY snapped three days of consecutive losses, erased on Thursday.

If the GBP/JPY continues its uptrend, the next resistance would be the February 27 high at 166.00. A breach of the latter will expose the December 19 daily high at 167.01, followed by the December 12 high at 169.27.

On the other hand, the GBP/JPY first support would be the psychological level at 164.00. Downside risks lie at the next support area at the 20-day Exponential Moving Average (EMA) at 161.87, ahead of testing the 50-day EMA at 161.18.

GBP/JPY Daily chart
GBPJPY Daily chart

GBP/JPY Technical levels

GBP/JPY

Overview
Today last price164.33
Today Daily Change0.73
Today Daily Change %0.45
Today daily open163.6
 
Trends
Daily SMA20162.02
Daily SMA50161.32
Daily SMA100162.37
Daily SMA200163.18
 
Levels
Previous Daily High163.68
Previous Daily Low161.36
Previous Weekly High163.34
Previous Weekly Low158.27
Previous Monthly High166.01
Previous Monthly Low156.73
Daily Fibonacci 38.2%162.8
Daily Fibonacci 61.8%162.25
Daily Pivot Point S1162.07
Daily Pivot Point S2160.55
Daily Pivot Point S3159.75
Daily Pivot Point R1164.4
Daily Pivot Point R2165.21
Daily Pivot Point R3166.73

Author

Christian Borjon Valencia

Markets analyst, news editor, and trading instructor with over 14 years of experience across FX, commodities, US equity indices, and global macro markets.


More from Christian Borjon Valencia
Share:

Editor's Picks

AUD/USD climbs toward 0.7000 after strong China data dump

AUD/USD attracts follow-through buyers for the second straight day on Monday, extending last week's recovery toward 0.7000 in Monday's Asian trading. Strong Chniese Q3 GDP and activity data for September strengthen the pair's advance, following RBA Assistant Governor Chris Kent's hawkish remarks.

USD/JPY struggles near 158.00 amid hawkish BoJ, subdued USD

USD/JPY remains defensive near 158.00 in the Asian session on Monday, as the US Dollar remains depressed near a two-week low amid the recent decline in US bond yields. Furthermore, looming intervention risks underpin the Japanese Yen and weigh on the pair amid BoJ Governor Kazuo Ueda's hawkish remarks. However, Fed rate-hike bets and geopolitical uncertainties could limit USD losses and the major.

Gold bulls hesitant below $4,200 as Fed risks and firmer USD cap intraday gains

Gold struggles to capitalize on modest intraday gains and remains below the $4,200 mark, well within a three-week-old trading range. US Federal Reserve Chair Kevin Warsh’s unwillingness to offer fresh cues on further policy moves forced investors to price out the possibility of policy tightening later this month. Moreover, the recent sharp pullback in US government bond yields from multi-year highs, which dragged the US Dollar to a two-week low on Friday, acts as a tailwind for bullion.

Pi Network: Weak momentum and waning demand reinforce downside bias

Pi Network edges lower, risking a bearish conclusion to its short-term consolidation above the $0.0774 horizontal support. A steady decline in the notional value of active PI futures contracts and the weekly spot trading volume suggests reduced retail demand. The PI token risks a retest of its record low around $0.0704 as bearish momentum remains dominant on the daily chart.

Canada CPI expected to show a pick-up in inflation in September

Canada’s September CPI figures will be the focus of attention on Monday. Indeed, Statistics Canada data will provide markets with an update on price pressures ahead of the BoC’s October 28 gathering, when officials are expected to keep the interest rate steady at 2.25%, broadly in line with analyst consensus.

Everyone's dumping Gold after hot US inflation. Here's why $4,100 could be a floor, not a cliff
Gold (XAU/USD) is recovering from a sharp sell-off triggered by hotter-than-expected United States (US) inflation data released on Wednesday. The precious metal briefly plunged toward $4,073 as investors increased their bets on further Federal Reserve (Fed) interest rate hikes before recovering as US Treasury yields and the US Dollar (USD) reversed their initial gains.