|

GBP/JPY Price Analysis: Bulls keep momentum steady, overbought indicators signal near-term correction possible

  • The pair rose to highs since 2007 at 199.90.
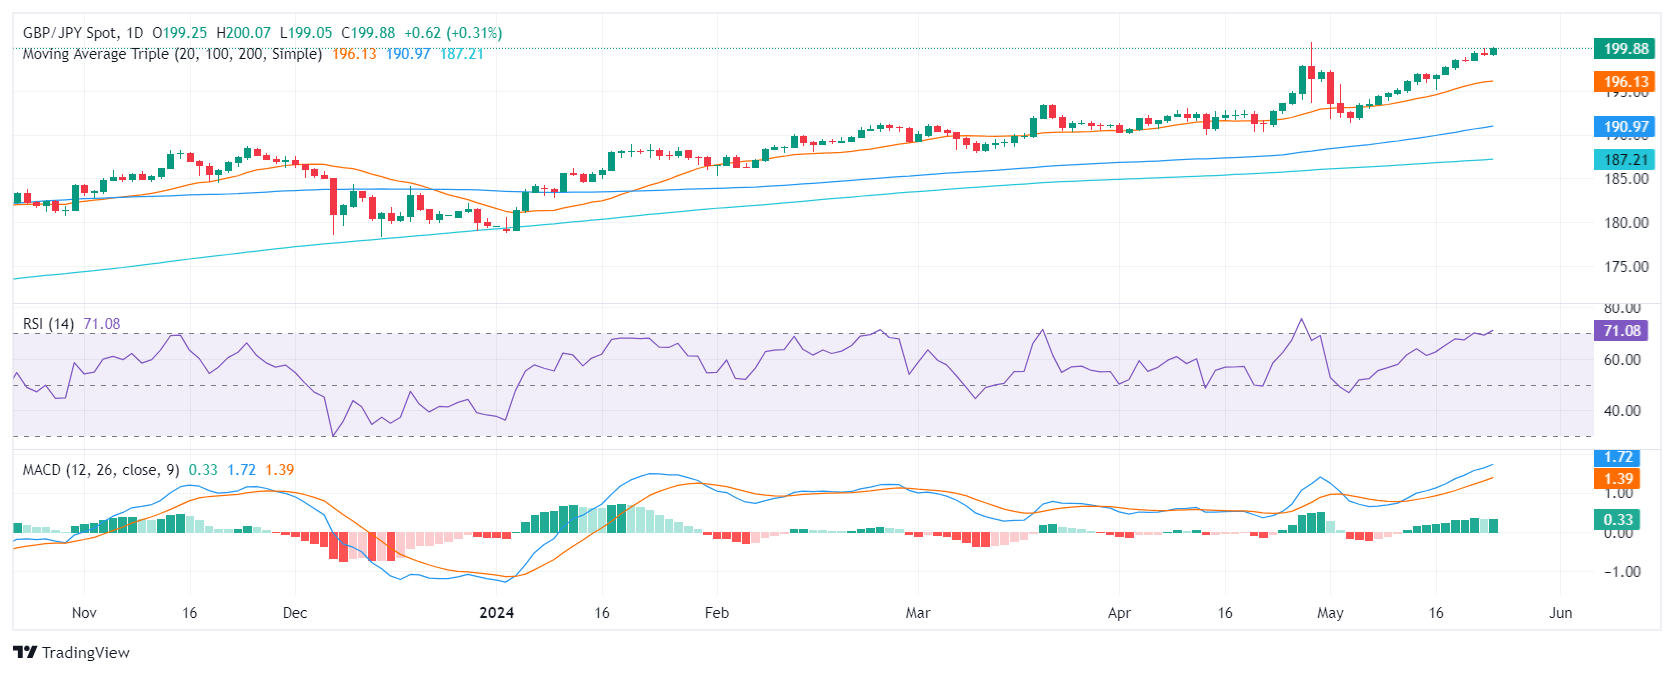
  • The daily RSI indicates an overextended buying momentum, suggesting a pending technical correction.
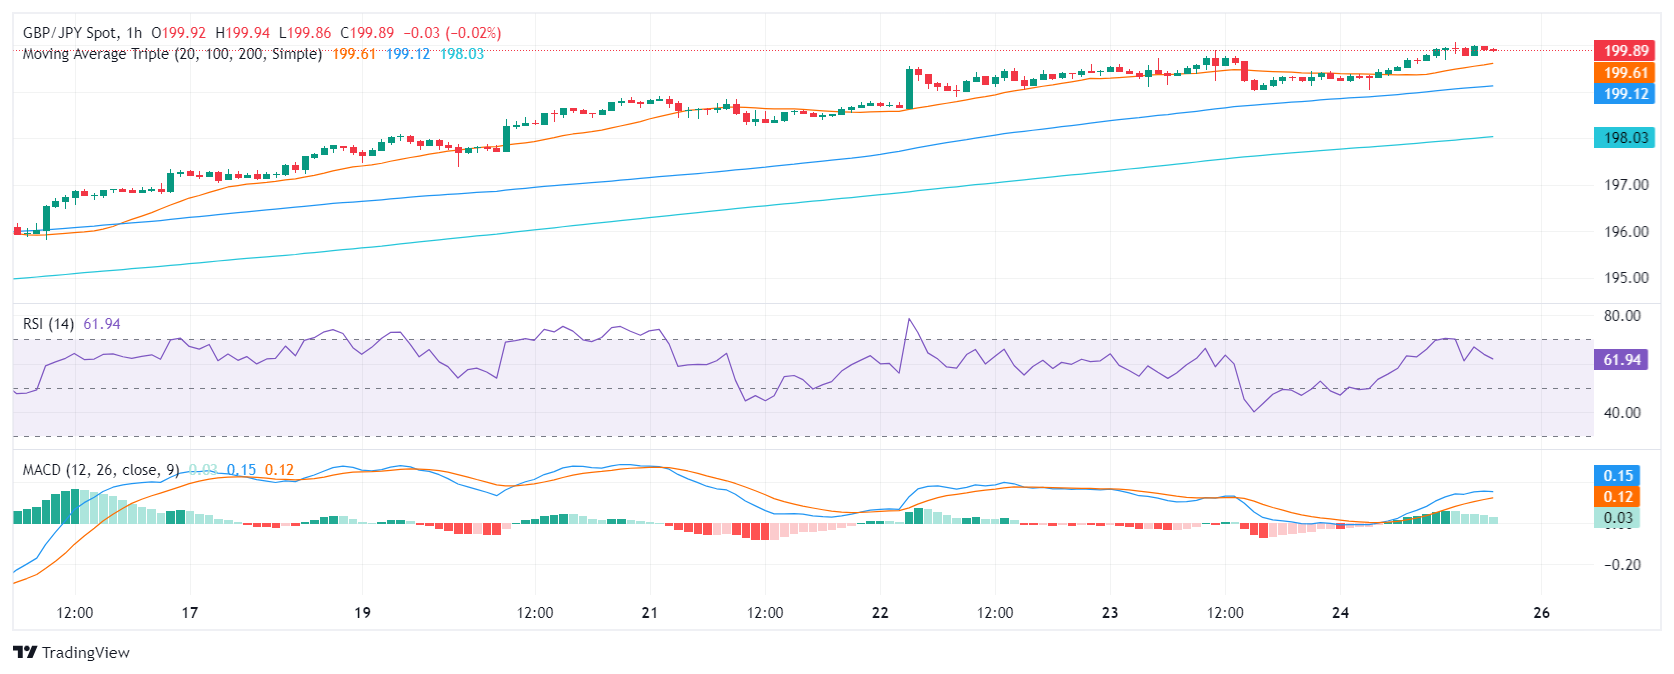
  • The hourly indicators have already started to consolidate.

In Friday’s session, the GBP/JPY pair experienced upward momentum, rising by 0.37% and the pair reached multi-year highs, a clear indication of the stronghold buyers have within the market. While a near-term technical correction could potentially occur due to the overbought condition, the overall outlook remains bullish for the cross.

In the daily chart, the Relative Strength Index (RSI) has moved deep into overbought territory. The persistently high values hint at strong buying sentiment, but they also suggest a potential future correction. The Moving Average Convergence Divergence (MACD) reveals flat green bars, indicating positive momentum despite the relatively stable trend which may suggest that the pair might consolidate for the rest of the session.

GBP/JPY daily chart

When examining the hourly chart, the RSI reveals noticeable ebbs and flows, with the latest value standing at 61. Although still positive, this level appears somewhat less intense when compared to the daily chart. The hourly MACD histogram continues to display flat green bars, indicating steady positive momentum which mirrors its daily counterpart.

GBP/JPY hourly chart

From a broader outlook, the GBP/JPY's position relative to its Simple Moving Averages (SMAs) helps to clarify the overall trend. The pair stands above the 20, 100, and 200-day SMAs, reflecting a bullish outlook for both short and long-term scenarios.

GBP/JPY

Overview
Today last price199.87
Today Daily Change0.61
Today Daily Change %0.31
Today daily open199.26
 
Trends
Daily SMA20196.03
Daily SMA50193.45
Daily SMA100190.81
Daily SMA200187.14
 
Levels
Previous Daily High199.9
Previous Daily Low199.02
Previous Weekly High197.86
Previous Weekly Low194.74
Previous Monthly High200.59
Previous Monthly Low190
Daily Fibonacci 38.2%199.36
Daily Fibonacci 61.8%199.56
Daily Pivot Point S1198.89
Daily Pivot Point S2198.51
Daily Pivot Point S3198.01
Daily Pivot Point R1199.77
Daily Pivot Point R2200.27
Daily Pivot Point R3200.64

Author

Patricio Martín

Patricio is an economist from Argentina passionate about global finance and understanding the daily movements of the markets.

More from Patricio Martín
Share:

Markets move fast. We move first.

Orange Juice Newsletter brings you expert driven insights - not headlines. Every day on your inbox.

By subscribing you agree to our Terms and conditions.

Editor's Picks

EUR/USD: Bulls pray for a dovish Fed

EUR/USD has finally taken a breather after a pretty energetic climb. The pair broke above 1.1680 in the second half of the week, reaching its highest levels in around two months before running into some selling pressure. Even so, it has gained almost two cents from the late-November dip just below 1.1500 the figure.

GBP/USD trims gains, recedes toward 1.3320

GBP/USD is struggling to keep its daily advance, coming under fresh pressure and retreating to the 1.3320 zone following a mild bullish attempt in the Greenback. Even though US consumer sentiment surprised to the upside, the US Dollar isn’t getting much love, as traders are far more interested in what the Fed will say next week.

Gold: Bullish momentum fades despite broad USD weakness

After rising more than 3.5% in the previous week, Gold has entered a consolidation phase and fluctuated at around $4,200. The Federal Reserve’s interest rate decision and revised Summary of Economic Projections, also known as the dot plot, could trigger the next directional move in XAU/USD. 

Week ahead: Rate cut or market shock? The Fed decides

Fed rate cut widely expected; dot plot and overall meeting rhetoric also matter. Risk appetite is supported by Fed rate cut expectations; cryptos show signs of life. RBA, BoC and SNB also meet; chances of surprises are relatively low. Dollar weakness could linger; both the aussie and the yen best positioned to gain further. Gold and oil eye Ukraine-Russia developments; a peace deal remains elusive.

Week ahead – Rate cut or market shock? The Fed decides

Fed rate cut widely expected; dot plot and overall meeting rhetoric also matter. Risk appetite is supported by Fed rate cut expectations; cryptos show signs of life. RBA, BoC and SNB also meet; chances of surprises are relatively low.

Ripple faces persistent bear risks, shrugging off ETF inflows

Ripple is extending its decline for the second consecutive day, trading at $2.06 at the time of writing on Friday. Sentiment surrounding the cross-border remittance token continues to lag despite steady inflows into XRP spot ETFs.