|

GBP/JPY Price Analysis: Aims for year-to-date high as bulls take control

  • GBP/JPY sees a bullish continuation, testing the year-to-date high amid a weaker JPY and BoE tightening expectations.
  • A move past the YTD high could propel the pair toward the 175.00 supply zone and possibly a seven-year high.
  • Potential correction below the Tenkan-Sen line could hit support at 172.66 and drop towards the Kijun-Sen line at 171.26.

GBP/JPY prints minuscule gains, with buyers eyeing a test of the year-to-date (YTD) high at 174.68 as the Asian session begins. On Wednesday, the GBP/JPY pair finished with gains of 0.42%, bolstered by a weaker Japanese Yen (JPY). Meanwhile, expectations for further tightening by the Bank of England (BoE) underpinned the Pound Sterling (GBP). Hence, the GBP/JPY exchanges hand at 174.28.

GBP/JPY Price Analysis: Technical outlook

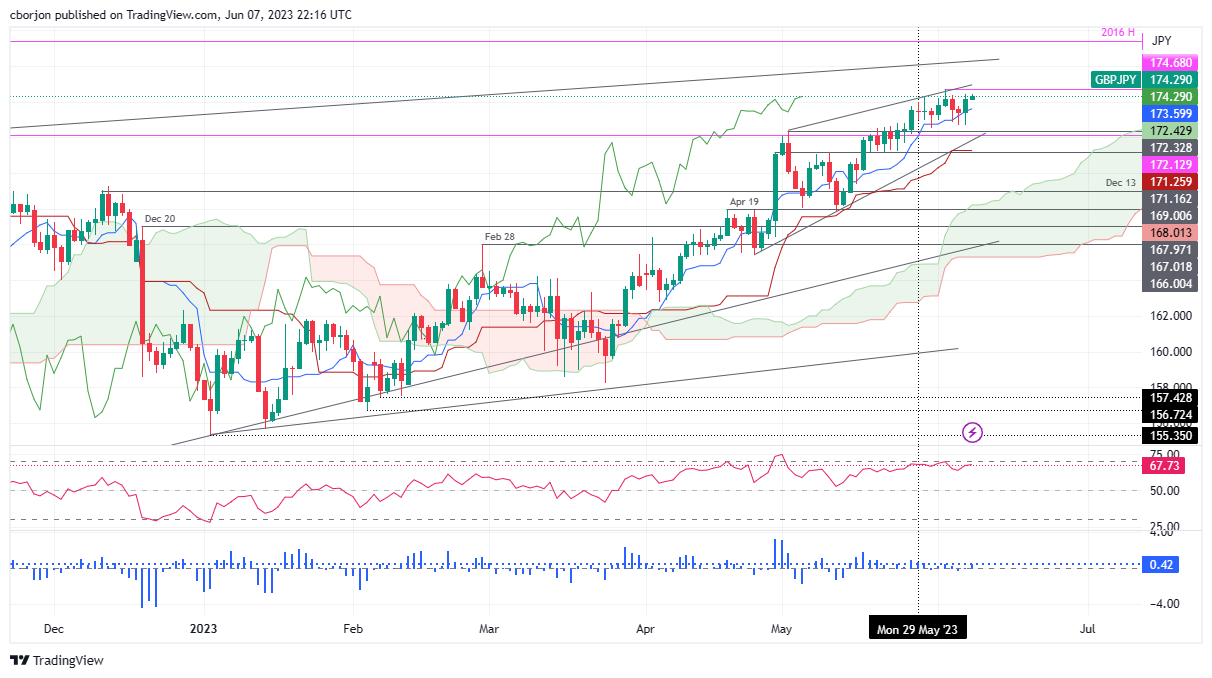
GBP/JPY is set for a bullish continuation, as shown by the daily time frame. As the pair closes into the YTD high, price action turns choppy, which could open the door for a reversal, as the Tenkan-Sen line, at 173.59, is the closest to the current price action.

If GBP/JPY extends its gains past the YTD high, the next supply zone would be 175.00. A rally above that level could pave the way for the GBP/JPY to hit seven-year new highs and test the 2016 yearly high at 177.37.

Conversely, a fall below the Tenkan-Sen line and the GBP/JPY might correct lower. First, support would be found at the weekly low of 172.66. A breach of the latter will expose 2022 yearly high shifted support at 172.13, ahead of falling toward the 172.00 figure. Downside risks lie beneath that level, with the Kijun-Sen line at 171.26.

GBP/JPY Price Action – Daily chart

GBP/JPY Daily chart

GBP/JPY

Overview
Today last price174.33
Today Daily Change0.85
Today Daily Change %0.49
Today daily open173.48
 
Trends
Daily SMA20172.1
Daily SMA50168.99
Daily SMA100165.11
Daily SMA200164.59
 
Levels
Previous Daily High173.78
Previous Daily Low172.68
Previous Weekly High174.68
Previous Weekly Low172.53
Previous Monthly High174.28
Previous Monthly Low167.84
Daily Fibonacci 38.2%173.1
Daily Fibonacci 61.8%173.36
Daily Pivot Point S1172.85
Daily Pivot Point S2172.21
Daily Pivot Point S3171.75
Daily Pivot Point R1173.94
Daily Pivot Point R2174.41
Daily Pivot Point R3175.04

Author

Christian Borjon Valencia

Christian Borjon began his career as a retail trader in 2010, mainly focused on technical analysis and strategies around it. He started as a swing trader, as he used to work in another industry unrelated to the financial markets.

More from Christian Borjon Valencia
Share:

Markets move fast. We move first.

Orange Juice Newsletter brings you expert driven insights - not headlines. Every day on your inbox.

By subscribing you agree to our Terms and conditions.

Editor's Picks

EUR/USD moves sideways below 1.1800 on Christmas Eve

EUR/USD struggles to find direction and trades in a narrow channel below 1.1800 after posting gains for two consecutive days. Bond and stock markets in the US will open at the usual time and close early on Christmas Eve, allowing the trading action to remain subdued. 

GBP/USD keeps range around 1.3500 amid quiet markets

GBP/USD keeps its range trade intact at around 1.3500 on Wednesday. The Pound Sterling holds the upper hand over the US Dollar amid pre-Christmas light trading as traders move to the sidelines heading into the holiday season. 

Gold retreats from record highs, trades below $4,500

Gold retreats after setting a new record-high above $4,520 earlier in the day and trades in a tight range below $4,500 as trading volumes thin out ahead of the Christmas break. The US Dollar selling bias remains unabated on the back of dovish Fed expectations, which continues to act as a tailwind for the bullion amid persistent geopolitical risks.

Shiba Inu's bears tighten grip, aiming for yearly lows

Shiba Inu price remains under pressure, trading below $0.000070 on Wednesday as bearish momentum continues to dominate the broader crypto market. On-chain and derivatives data further support the bearish sentiment, while technical analysis suggests a deeper correction targeting the yearly lows.

Economic outlook 2026-2027 in advanced countries: Solidity test

After a year marked by global economic resilience and ending on a note of optimism, 2026 looks promising and could be a year of solid economic performance. In our baseline scenario, we expect most of the supportive factors at work in 2025 to continue to play a role in 2026.

Stellar Price Forecast: XLM slips below $0.22 as bearish momentum builds

Stellar (XLM) price is trading below $0.22 at the time of writing on Wednesday after failing to close above the key resistance earlier this week. Bearish momentum continues to strengthen, with open interest falling and short bets rising.