|

GBP/JPY gains ground after hot inflation data from the UK

  • On Wednesday's session, the GBP/JPY traded in the 179.93 - 181.61 range.
  • Rising Gilts amid hot inflation figures from the UK gave the British Pound traction.
  • The Yen weakened on dovish BoJ minutes ahead of inflation figures on Friday.

The GBP/JPY cross trades with gains on Wednesday as hot inflation figures from the UK fueled a rise in the British Gilts, resulting in gains on the GBP ahead of Bank of England’s (BoE) monetary policy decision on Thursday. On the other hand, the Yen lost ground after the Bank of Japan (BoJ) minutes revealed that members consider it appropriate to maintain its dovish stance.

UK reported hot inflation figures 

On Wednesday, the Office for National Statistics from the UK released that inflation, as per the Consumer Price Index (CPI), rose to 8.7% YoY in May vs 8.4% and from its previous figure of 8.7% in April. In addition, the Core figure accelerated to 7.1%, above the 6.8% expected and from the last reading of 6.8%.

Considering this, the British yields are seeing gains across the curve. The 10-year bond yield rose to 4.48%, while the 2-year yield stands at 5.15% and the 5-year at 4.68%, respectively. That being said, the stronger case for BoE’s Thursday decision is a 25 basis point (bps) hike,  which is only near 15% odds of a bigger hike of 50 bps as per World Interest Rate Possibilities (WIRP). In addition, eyes will be on the updated macroeconomic forecast and the vote split of the Monetary Police Committee (MPC).

On the other hand, following the release of the dovish minutes from April’s BoJ meeting, eyes are set on Friday's inflation figures from Japan. In that sense, economists anticipate a year-on-year increase in the CPI to reach 4.1%, surpassing the previous reading of 3.5%. Additionally, the Core inflation rate, which factors out the impact of oil and food prices, is projected to rise from the previous figure of 4.1% to 4.4%.

GBP/JPY Levels to watch

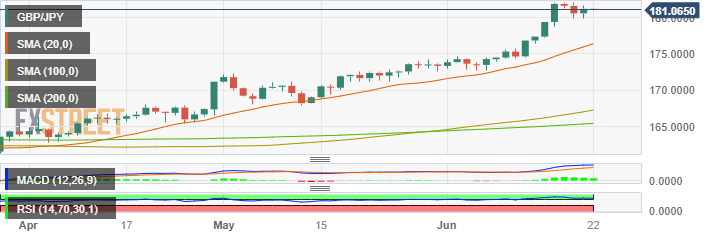
According to the daily chart, the GBP/JPY holds a bullish outlook for the short term.  The Relative Strength Index (RSI) and Moving Average Convergence Divergence (MACD) suggest that buyers are in control while the pair trades above its main moving averages.

Upcoming resistance for GBP/JPY is seen at the daily low of 181.60, followed by the zone at 182.00 and the cycle low at 182.12. On the other hand,The 180.50 area level is key for GBP/JPY to maintain its upside bias. If breached, the price could see a steeper decline towards the 179.90 zone and 179.50 level.

GBP/JPY Daily chart
GBP/JPY

Overview
Today last price181.08
Today Daily Change0.51
Today Daily Change %0.28
Today daily open180.57
 
Trends
Daily SMA20175.53
Daily SMA50171.63
Daily SMA100166.81
Daily SMA200165.27
 
Levels
Previous Daily High182.1
Previous Daily Low179.93
Previous Weekly High182.04
Previous Weekly Low174.36
Previous Monthly High174.28
Previous Monthly Low167.84
Daily Fibonacci 38.2%180.76
Daily Fibonacci 61.8%181.27
Daily Pivot Point S1179.63
Daily Pivot Point S2178.7
Daily Pivot Point S3177.47
Daily Pivot Point R1181.8
Daily Pivot Point R2183.03
Daily Pivot Point R3183.97


Author

Patricio Martín

Patricio is an economist from Argentina passionate about global finance and understanding the daily movements of the markets.


More from Patricio Martín
Share:

Editor's Picks

AUD/USD recovers toward 0.7000 amid improving mood

AUD/USD is firming up toward 0.7000 in Asia on Tuesday, helped by improving market mood. A pause in the US Dollar rebound also aids the pair's upside. However, geopolitical risks and caution ahead of AI tech earnings report could limit the pair.

USD/JPY flatlines near 158.50 as markets seek direction

USD/JPY steadies around 158.50 in the Asian trading hours on Tuesday. Traders prefer to wait on the sidelines ahead of Japan’s National Consumer Price Index inflation data later on Friday. Meanwhile, elevated US bond yields provide some support to the US Dollar against the Japanese Yen.

Gold slides amid recovery in bond yields, higher oil prices

Gold price declines to near $4,120 in the early European trade. The precious metal faces selling pressure amid a recovery in yields on United States bonds and rising oil prices. US Treasury Yields have shown signs of recovery, with US hyperscalers set to report their Q3 earnings in near time. As of writing, 10-year US Treasury Yields are down 0.35% to near 5.13%

NEAR Protocol: Mild correction persists despite resilient ETF inflows

NEAR Protocol price is down nearly 2% on Tuesday, mirroring its 2% decline from the previous day. Institutional demand remains firm, with Bitwise’s NEAR-focused Exchange Traded Fund (ETF) recording over $5 million in inflows on Monday.

Chip bounce fails to inspire Asia and France weighs on Europe
Preview: US chips rebound, but Europe and Asia slide; oil firms on Gulf supply fears. Risk caught a bid on Monday, buoyed by better-than-expected Chinese Q3 26 GDP growth and a rebound in chipmakers. US equity benchmarks recovered most of Friday’s lost ground, with the S&P 500 touching gloves with the underside of its 50-day SMA around 7,705 and the Nasdaq 100 leading the way, adding 1.2%.
The US Dollar fell. Gold didn't rally. That tells you everything
Gold (XAU/USD) is struggling to capitalize on a weaker US Dollar (USD), after repeatedly failing to establish itself above the $4,200 level. The precious metal remains confined to a relatively narrow trading range despite a combination of developments that would normally support higher prices.