|

GBP/JPY consolidating below 182.00 ahead of Japan CPI, UK GDP

  • The GBP/JPY is stuck in familiar levels after a quiet early half of the trading week.
  • Japanese CPI inflation and UK GDP growth figures due for the Friday trading sessions.
  • Bearish correction in the Guppy is struggling to develop meaningful momentum.

The GBP/JPY continues to struggle to push decisively in either direction and has been constrained between the 182.00 and 181.00 major levels for the past week despite being down 1.7% for September.

The early trading week saw limited economic data releases for both the Pound Sterling (GBP) and the Japanese Yen (JPY), but the week is set to close out with meaningful data for both sides of the Guppy.

Friday sees the Tokyo Consumer Price Index (CPI) inflation reading for Japan, which last printed at 2.9% for the headline annualized figure in August. September's Core Tokyo CPI last saw 4.0% for the same period, and Yen bidders will be watching closely.

Despite Japanese inflation printing above the Bank of Japan's (BoJ) 2% target, the BoJ is concerned about inflation sinking below target in a projected slowdown for Japanese price growth, and the Japanese central bank will be looking for evidence that inflation is anchoring in longer-term before reversing its negative rate policy regime.

On the UK side, Friday will see Gross Domestic Product figures, which is forecast to hold steady at 0.2%. The UK is facing a broad economic slowdown in the economic data, and a miss in forecasts could see the Pound Sterling sagging even lower on the charts.

GBP/JPY technical outlook

The Guppy lifted from yesterday's lows near 180.90 but the GBP/JPY is getting capped by price action just below 181.70. Hourly candles have remained pinned to the 34-hour Exponential Moving Average (EMA) as momentum bleeds out.

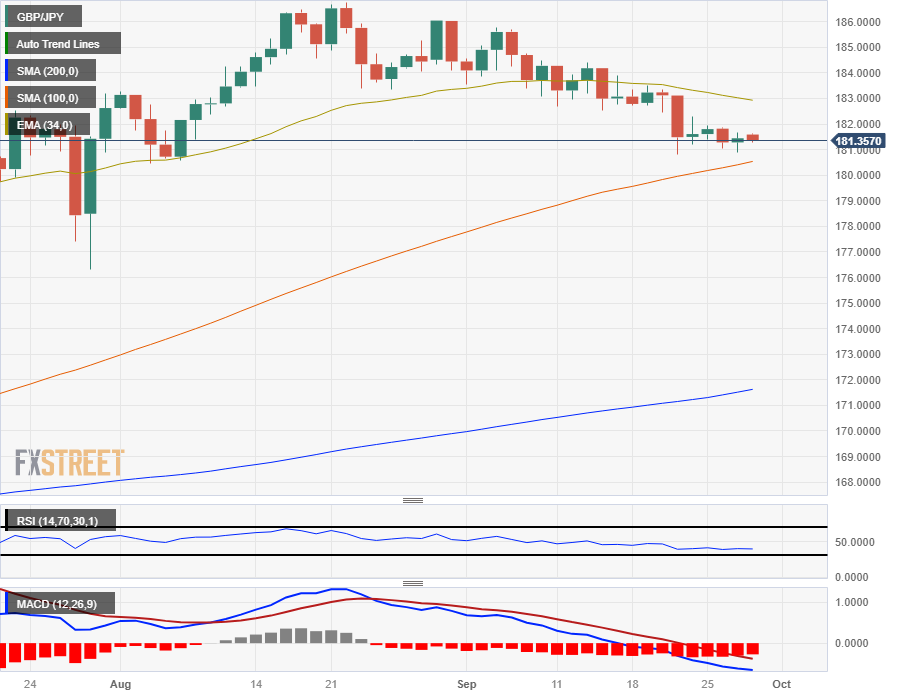
On the daily candlesticks, the GBP/JPY is dragging back into the 100-day Simple Moving Average (SMA) just above 180.00, with the 200-day SMA far below current bid levels near 172.00.

The Guppy's medium-term walkback is seeing limited downside, but the slow-motion downside is seeing technical indicators starting to signal oversold conditions, with the Relative Strength Index (RSI) approaching the lower boundaries on a 14-day rolling basis.

GBP/JPY daily chart

GBP/JPY technical levels

GBP/JPY

Overview
Today last price181.43
Today Daily Change0.15
Today Daily Change %0.08
Today daily open181.28
 
Trends
Daily SMA20183.52
Daily SMA50183.28
Daily SMA100180.29
Daily SMA200171.41
 
Levels
Previous Daily High181.87
Previous Daily Low181.05
Previous Weekly High183.49
Previous Weekly Low180.82
Previous Monthly High186.77
Previous Monthly Low180.46
Daily Fibonacci 38.2%181.37
Daily Fibonacci 61.8%181.56
Daily Pivot Point S1180.93
Daily Pivot Point S2180.58
Daily Pivot Point S3180.11
Daily Pivot Point R1181.75
Daily Pivot Point R2182.22
Daily Pivot Point R3182.57

Author

Joshua Gibson

Joshua joins the FXStreet team as an Economics and Finance double major from Vancouver Island University with twelve years' experience as an independent trader focusing on technical analysis.

More from Joshua Gibson
Share:

Editor's Picks

GBP/USD: Gains remain capped below 1.3200 ahead of US PCE

GBP/USD clings to minor recovery gains, but remains below 1.3200 in the European session on Thursday. However, the potential upside for the pair appear limited amid UK political instability and rising expectations of US interest rate hikes this year. Traders await the US May PCE inflation data on Thursday for a clear direction.

EUR/USD defends 1.1350 as eyes turn to US PCE inflation

EUR/USD trades better bid above 1.1350 in European trading on Thursday. A pause in the US Dollar rally is helping the pair stay afloat. Markets look to the key US Personal Consumption Expenditures report for fresh trading impetus.

Gold consolidates around $4,000 ahead of US PCE data

Gold enters a bearish consolidation phase during the first half of the European session, and currently trades around the $4,000 psychological mark. The commodity sticks to its bearish bias for the third straight day, and remains close to the lowest level since November 2025, touched on Wednesday, as traders await the crucial US inflation data.

Bitcoin tests $60,000 as whales sell off – Aave and Jupiter show resilience

The broader cryptocurrency market remains under intense selling pressure, with Bitcoin back at $60,000 for the third time this year. On-chain data shows selling pressure from large-wallet investors, commonly referred to as whales, while total liquidations hit nearly $1 billion in 24 hours.

Bitcoin nears make-or-break level ahead of US PCE data

Bitcoin recovers slightly, trading at $61,700 after reaching a new yearly low of $59,103 and a 21-month low the previous day. This bearish price action is supported by the ongoing institutional sell-off, which recorded an outflow of over $469 million on Wednesday.

Regime change: Inside Kevin Warsh's first move to make the Fed unreadable on purpose

The rate did not move. That was the least interesting thing about Kevin Warsh's first meeting in charge of the Fed. The FOMC held its benchmark at 3.50%-3.75% for the fourth straight meeting, exactly as priced, and then the new chair used his first press conference to dismantle the machinery the market has leaned on for a decade.