|

GBP/CAD Price Forecast: Possible reversal of trend could lead to more downside

  • GBP/CAD may be beginning a bearish phase after touching the top of its channel and reversing lower. 
  • It is showing bearish divergence with momentum. 

GBP/CAD might have reversed its short-term uptrend after testing the top of its rising channel, forming a bearish reversal candlestick pattern (orange rectangle on chart below) and then establishing a sequence of lower lows and lower highs. 

GBP/CAD 4-hour Chart 

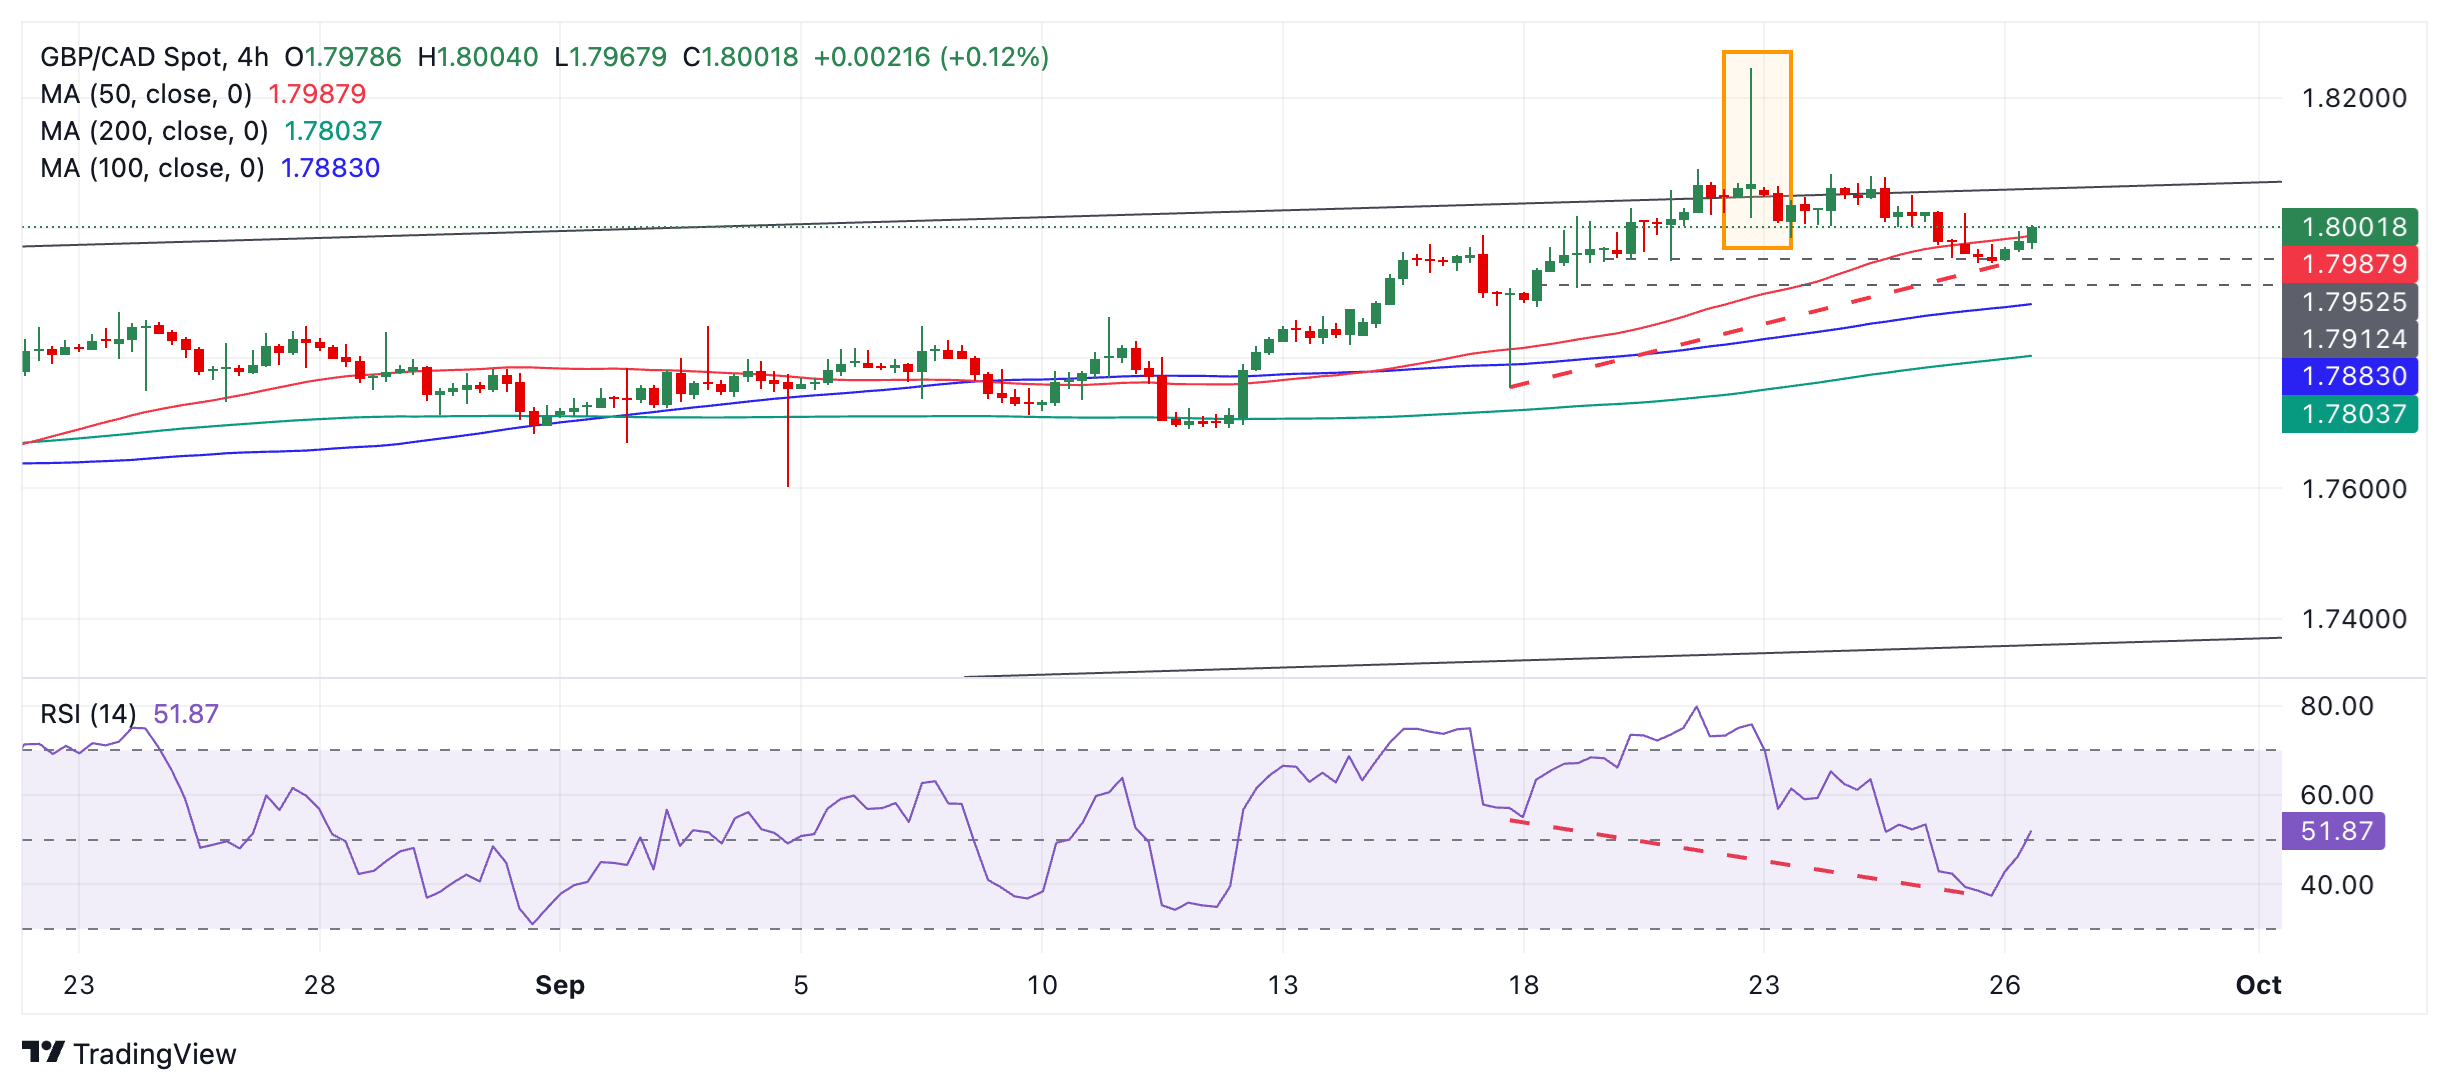
Although GBP/CAD has pulled back over recent periods, it has probably reversed trend and a break below 1.7946 (September 25 low) would confirm more downside. Downside targets lie at 1.7754 (September 17 low and 50-day SMA), 1.7694 (September 16 low) and 1.7603 (September 4 low) and 1.7407 (August 8 low). A break below 1.7907 would provide stronger confirmation. 

Although GBP/CAD is in an uptrend on all time frames, it is nevertheless oscillating within an ascending channel. It is possible, therefore, that it may be entering one of its counter-trend bear phases. 

The Relative Strength Index (RSI) has formed a bearish divergence with price compared to the September 17 low (red dashed line on chart above). Although the price was much lower on September 17 momentum was not. This suggests underlying weakness could push prices down. 

A break above the high of the Shooting Star at 1.8245 would confirm a resumption of the uptrend. If so, the next target lies at 1.8278, the 61.8% extrapolation of the prior move higher. 

Any further bullishness beyond the confines of the channel is likely to be short-lived, however. Such moves are signs of “exhaustion” and are a precursor to deeper corrections on the horizon.

Author

Joaquin Monfort

Joaquin Monfort is a financial writer and analyst with over 10 years experience writing about financial markets and alt data. He holds a degree in Anthropology from London University and a Diploma in Technical analysis.

More from Joaquin Monfort
Share:

Editor's Picks

EUR/USD seems fragile below 1.1700 as Middle East war boosts energy prices

The EUR/USD pair trades flat at around 1.1680 during the Asian trading session on Tuesday, but broadly seems vulnerable, being close to its five-week low. The major currency pair is under pressure as surging oil prices due to the United States-Israel war with Iran have increased the risks of higher inflation for the Old Continent.

GBP/USD hovers around 1.3400 with bearish pressure intact

GBP/USD edges higher after three days of losses, trading around 1.3400 during the Asian hours on Tuesday. The technical analysis of the daily chart indicates an ongoing bearish bias, as the pair trades within a descending channel pattern.

Gold sticks to gains above $5,350 amid sustained safe-haven demand; firmer USD caps gains

Gold sticks to its positive bias for the third straight day and trades above the $5,350 level heading into the European session on Tuesday. Concerns about a broader regional conflict in the Middle East continue to weigh on investors' sentiment and underpin demand for the traditional safe-haven bullion.

Top Crypto Gainers: Near Protocol, Virtuals Protocol, and Morpho lead market recovery

Near Protocol, Virtuals Protocol, and Morpho are leading the market recovery with double-digit gains over the last 24 hours. Technically, NEAR extends the breakout of the falling channel pattern, VIRTUAL holds above the 50-day EMA, while MORPHO tests a crucial resistance. 

The market is not panicking it is repricing the probability distribution of Oil and time

At the end of the day, markets do not trade morality or geopolitics. They trade transmission channels. And the only channel that truly matters in this maelstrom runs through the price of energy and the time value of money.

Grass 20% bullish breakout defies broader market weakness

Grass (GRASS) is edging up above $0.30 at the time of writing on Monday. The token’s notable 20% intraday surge stands out amid heightened volatility in the broader crypto market.