FORD (F) is still not ready to resume the rally

Ford Motor Company is an American multinational automobile manufacturer headquartered in Dearborn, Michigan, United States. It was founded by Henry Ford and incorporated on June 16, 1903. The company sells automobiles and commercial vehicles under the Ford brand, and luxury cars under its Lincoln luxury brand.
FORD (F) daily chart August 2023
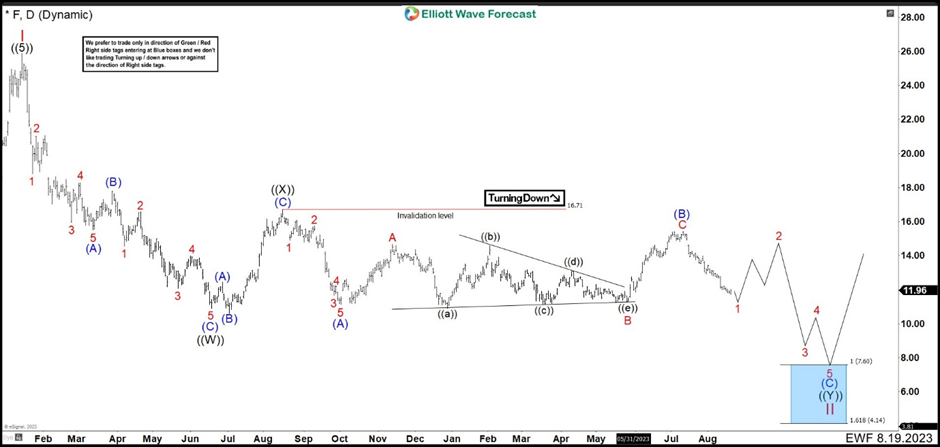
One year ago, we called that Ford (F) needed more downside as price action stays below 16.68 high to complete a wave II correction around 7.60 – 4.14 area. In January 2022 Ford made a high at 25.87 and we called wave I and the market started a wave II correction. Down from this high, the stock developed a zig zag correction ending at 10.90 low and we called wave ((W)). Since then, shares entered in a sideways phase. In this range, after ((W)) a flat correction took a part building wave ((X)) connector ending at 16.68 high.
FORD (F) daily chart April 2024
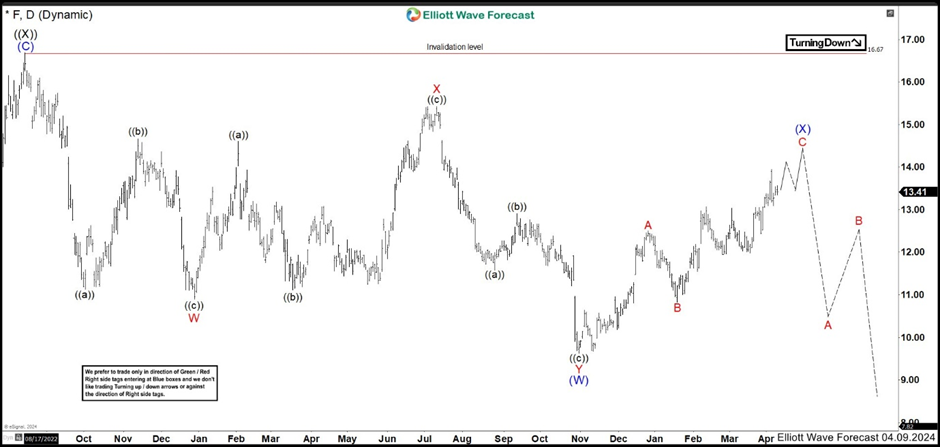
The Market continued lower and we are expecting a double correction (W), (X), (Y) to complete wave ((Y)). Down from August 2022 high, we can see 3 swings lower ending wave W at 10.90. The market bounce in 3 swings higher as a flat correction finishing wave X at 15.42 high. Then, another 3 swings zig zag correction fell completing wave Y at 9.63 low and also wave (W). A new rally started from wave (W) low to develop a structure of 3 swings as wave (X). (If you want to learn more about Elliott Wave Theory, follow these links: Elliott Wave Education and Elliott Wave Theory).
FORD (F) daily chart August 2024
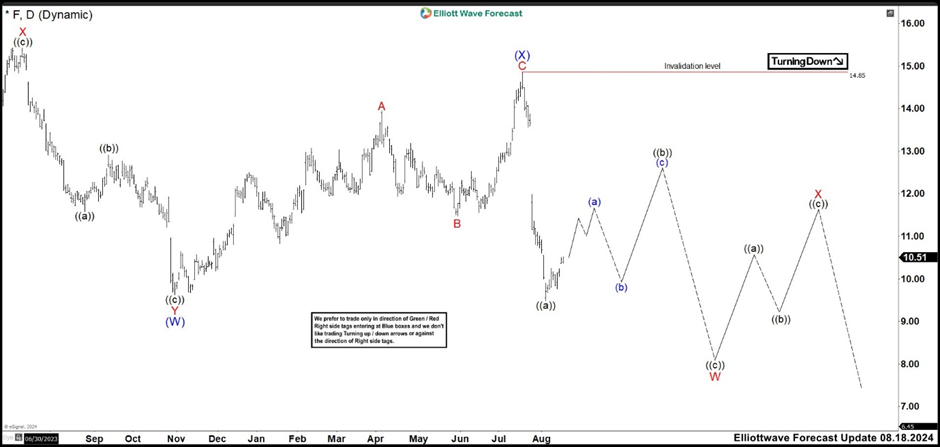
First leg higher ended wave A of (X) at 13.95 high and wave B pullback finished at 11.48. wave C ended at 14.85 high and also the connector (X) in higher degree. From this price, Ford has continued to the downside in wave (Y) of ((Y)) of II to complete the whole correction from January 2022 high. This wave (Y), we are calling as double correction W, X, Y. The market broke the last low of wave (W) ending wave ((a)) of W at 9.49 low. We are expecting 3 swings higher in wave ((b)) to fail below 14.85 high to continue lower. If market breaks above 14.85, the wave II correction could be completed and we are going to look for buying opportunities only.
Author

Elliott Wave Forecast Team
ElliottWave-Forecast.com


