Fluor corporation (FLR Stock) earnings preview

Fluor Corporation is a holding entity that operates in four major segments:
-
Energy and chemical.
-
Industrial, mining, infrastructure and power.
-
Different services.
-
Government.
The company offers professional services of fabrication, construction, procurement and engineering services on an international basis.
Earnings preview
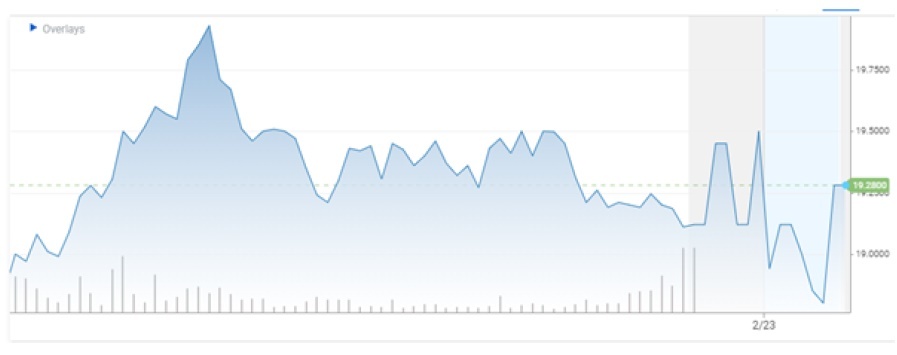
The corporation will publish its earnings report for the first quarter on Friday, Feb 26, 2021. The share price of the company is around $19, near the 52- week high of $21.
The report will cover the fiscal quarter that ended January 21. According to MarketBeat, there are only two analysts that recorded their opinion on the earnings forecast of the Fluor Corporation. The company has rating of 2.17 out of 5 based on one Buy rating and 5 Hold ratings while there is no Sell rating. According to the official website of Fluor, the analyst rating is 3 out of 5 which means that the stance on the stock is neutral.
Key stats
2. Average volume:
2.16 million shares.
3. Market cap: $2.69 billion.
4. PE Ratio: not applicable.
5. Dividend yield: not applicable.
6. Earnings per share: $0.14.
7. One-year change: 19.7%.
8. Beta: 2.85.
Estimate
According to Investing.com, the estimated earning per share for the company is 0.2215 while the estimated revenue for the period is $3.69 billion. Meanwhile the earning per share of the previous quarter was estimated at 0.2815 while the actual EPS came in at 0.14.
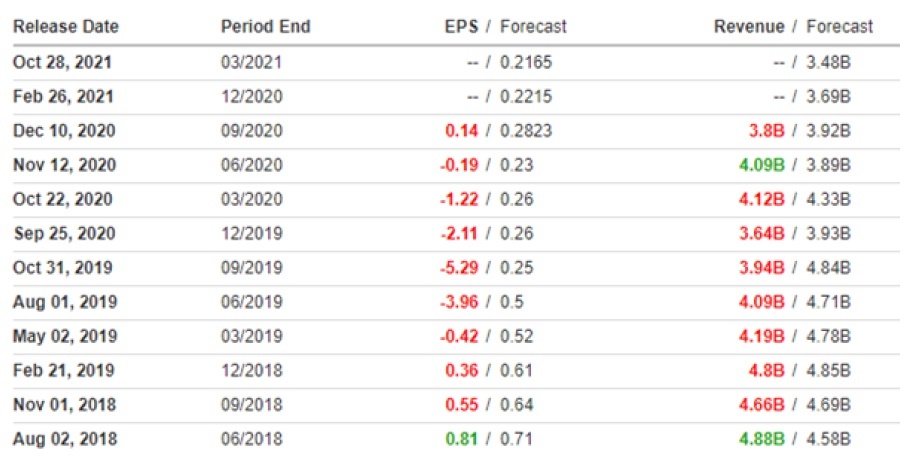
The above table clearly reveals that there is a consistent downtrend in the actual EPS and revenue of the company. According to the company’s official website, out of the last four estimates of EPS one points at up while none point at the downside. The high was 0.27 while the low was 0.10 and the median is 0.14. According to MarketBeat, the analysts have consensus on the share price target of $13 which is 31% down from the current $19.
In the last two years, the company managed to beat the estimate once in revenue but could not beat any estimate of EPS. The earnings per share of the company has been constantly dropping over the past two years.
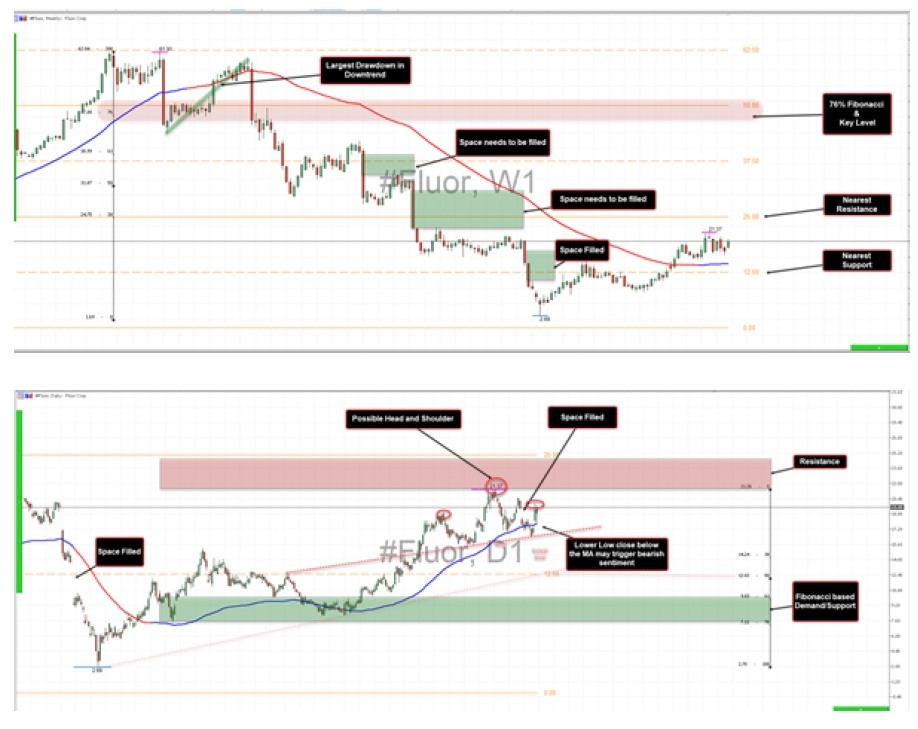
Technical analysis
The chart of Fluor Corporation gives a very clear picture of the market condition. The daily chart reveals increasing volume with bullish candles while the immediate resistance for the price is slightly above $20 ahead of the 52-week high around $21. The price is comfortable above the 20-day simple moving average while the recent daily candle has a long shadow on the downside. This is a strong bullish sign.
In the past three earning reports published, the share price rose twice after the release of reports. On the downside, immediate support lies at $16.5 ahead of $15.5 where buying interest can be observed.
Premium
You have reached your limit of 3 free articles for this month.
Start your subscription and get access to all our original articles.


