Financial and Banking Sector (XLF) heading for a tough period

The Financial and banking sector (XLF) was all over the news last month. It is currently no longer part of the daily news cycle. We believe trouble is underway for the second part of the year. Price action across the sector points to a massive sell-off after an initial trap. Many traders believe the market moves in a straight line but that it is far from reality. When a recovery like the one from the middle of March happens, they get trapped and stop looking at the facts. The Elliott Wave Theory’s main pattern is that the Market move in five waves and will correct the five with a three, seven, or eleven structure. Here is the main pattern in a chart:
Elliott Wave 5 waves rally and 3 waves corrective pattern
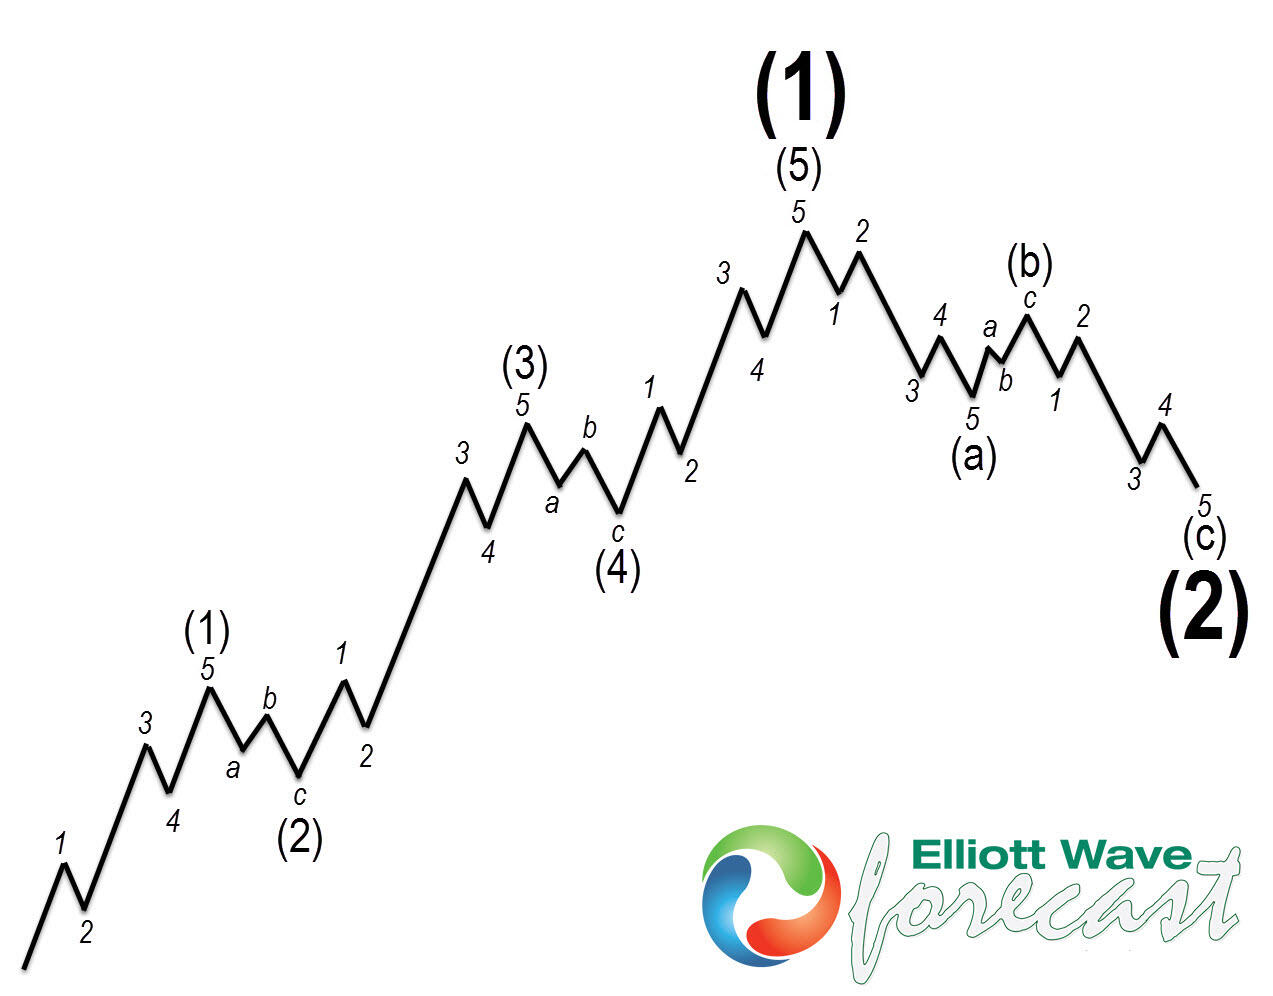
The pattern above shows a very clear and well-defined price action. It repeats in each time frame from the minute to the Grand Super Cycle. JPM (JP Morgan Chase) chart below shows the pattern within the Grand Super Cycle. It has already ended the 5 waves advance, and now in the process of correcting in three, seven, and eleven sequences.
JPM daily Elliott Wave chart
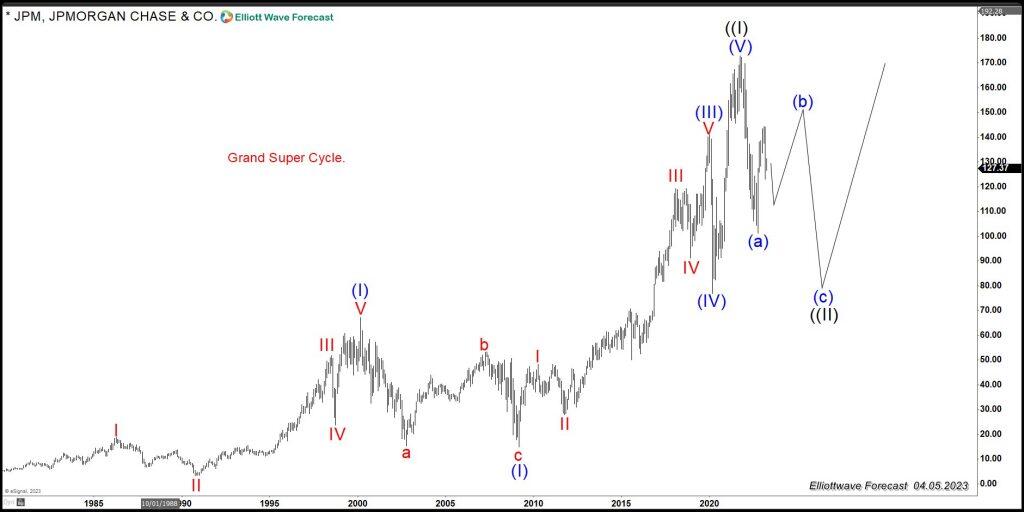
JPM Chart above shows it ended wave (a) and is correcting higher in wave (b). A massive sell- off in wave (c) will come again sometime later in 2023. In the end, it will provide another huge opportunity to buy the Grand Super Cycle wave ((II)). Another big bank BAC or Bank of America below shows the path within the correction. Since the peak in 2022, BAC shows what we call a bearish sequence. It happens when a three waves structure develops and incomplete. We have a new low below (a) with momentum divergence. Many traders call it positive divergence and buy or sell based on the divergency. But we don’t do it like that. For us, the break below wave (a) creates a lower low and incomplete bearish sequence from wave (I) favoring further downside.
BAC weekly Elliott Wave chart
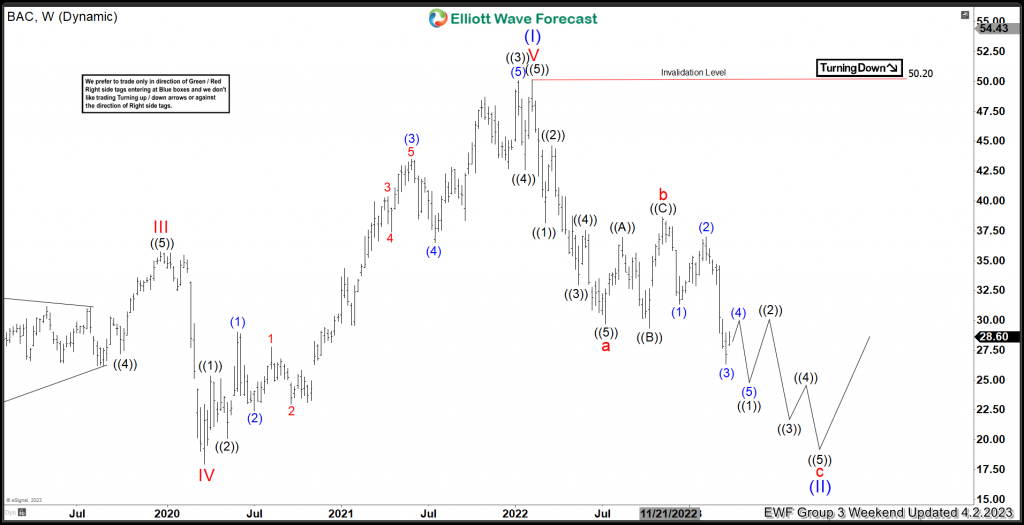
The chart above shows the corrective structure in BAC. It can do corrective rally in wave ((2)) at some point before wave ((3)) lower resumes. Wave ((3)) will be a massive selling and will agree with JMP wave (c) lower. JPM and BAC are leaders within the banking sector. The Sector’s overall price action is showing an ABC in process. Wave ((A)) is clearly an impulse, and we should now be bouncing in wave (2), with wave (3) to happen sometimes in 2023.
XLF weekly Elliott Wave chart
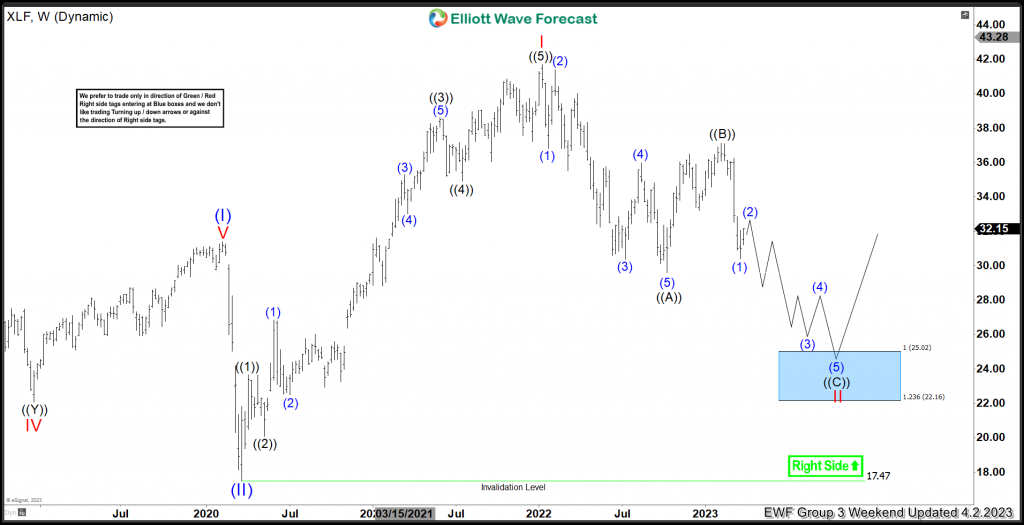
Financial Sector ETF (XLF) chart above shows the proposed path lower within a zigzag structure. We can see the difference with BAC; even when they look very similar. BAC already took the lows in wave a, whereas XLF has not broken below wave ((A)). However, XLF reaction lower from wave ((B)) is an impulse., which supports our view for further downside.
Inc conclusion: We see many signs pointing to a massive sell-off across the banking sector sometime in 2023. This might catch some traders by surprise, but it will also affect the whole Market. This is one of the reasons we believe 2023 will still be a year in which Indices, Stocks, and ETFs will be erratic. It will provide many opportunities to both sides of the market. But we need to keep in mind the trend is always bullish within the Grand Super Cycle. Sometimes near the end of 2023, it may provide a huge one in a life time investment opportunity across the sector.
Author

Elliott Wave Forecast Team
ElliottWave-Forecast.com


